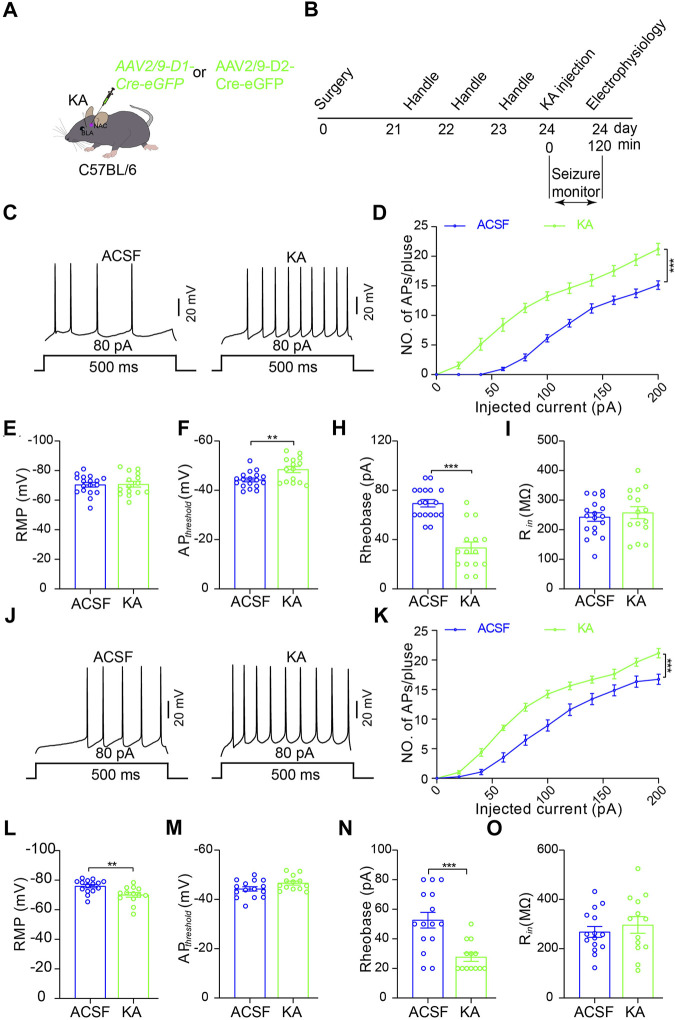
FIGURE 3.
Increased excitability of D1R- and D2R-MSNs in the NAc shell after TLE seizures. (A) Schematic diagram of virus microinjection to enable expression of eGFP reporter on D1R-MSNs or D2R-MSNs in the NAc shell and KA microinjection into BLA to induce TLE seizures of C57BL/6 mouse. (B) Schematic diagram of TLE seizure induction followed by in intro electrophysiological recording in the NAc shell. (C) Representative current-clamp recordings. (D) Summary input–output curves of D1R-MSN of the mice treated KA (n = 15 cells) show increased AP generations in response to current injections, comparing with the control mice treated with ACSF (n = 18 cells). ***p < 0.001, F = 70.049, df = 1, two-way ANOVA with Tukey post-hoc test. (E–I) Summary data of resting membrane potential (RMP), AP threshold, rheobase current, and membrane input resistance (Rin) of D1R-MSN of the mice treated with ACSF (n = 18 cells) or KA (n = 15 cells). **p < 0.01, ***p < 0.001, Student’s unpaired t-test. (J) Representative current-clamp recordings and (K) summary input–output curves of D2R-MSN of the mice treated KA (n = 13 cells) show increased AP generations in response to current injections, compared with the control mice treated with ACSF (n = 15 cells). ***p < 0.001, F = 20.136, df = 1, two-way ANOVA with Tukey post-hoc test. (L–O) Summary data of resting membrane potential (RMP), AP threshold, rheobase current, and membrane input resistance (Rin) of D2R-MSN of the mice treated with ACSF (n = 15 cells) or KA (n = 13 cells). **p < 0.01, ***p < 0.001, student’s unpaired t-test.

