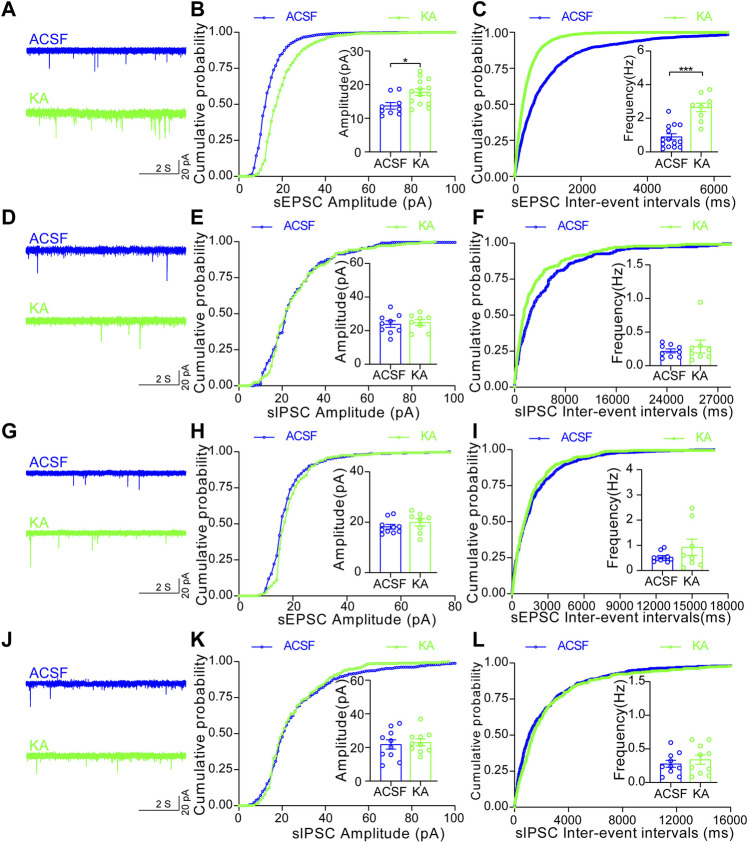
FIGURE 4.
Increased synaptic transmission of D1R-MSN, but not D2R-MSN, in the NAc shell after TLE seizures. (A) Representative sEPSC of D1R-MSN of the mice treated with ACSF or KA. (B) Cumulative probability of the amplitudes and the averaged amplitude of sEPSCs of D1R-MSN of the mice treated with ACSF (n = 9 cells) or KA (n = 14 cells). *p < 0.05, Student’s unpaired t-test (the same test was used below in this figure). (C) Cumulative probability of the inter-event intervals of sEPSCs and the averaged frequency of sEPSCs of D1R-MSN of the mice treated with ACSF (n = 14 cells) or KA (n = 9 cells). ***p < 0.001. (D) Representative recordings of sIPSC of D1R-MSN of the mice treated with ACSF or KA. (E) Cumulative probability of the amplitudes and the averaged amplitude of sIPSCs of D1R-MSN of the mice treated with ACSF (n = 9 cells) or KA (n = 8 cells). (F) Cumulative probability of the inter-event intervals of sIPSCs and the averaged frequency of sIPSCs of D1R-MSN of the mice treated with ACSF (n = 9 cells) or KA (n = 8 cells). (G) Representative recordings of sEPSC of D2R-MSN of the mice treated with ACSF or KA. (H) Cumulative probability of the amplitudes and the averaged amplitude of sEPSCs of D2R-MSN of the mice treated with ACSF (n = 10 cells) or KA (n = 8 cells). (I) Cumulative probability of the inter-event intervals of sEPSCs and the averaged frequency of sEPSCs of D2R-MSN of the mice treated with ACSF (n = 10 cells) or KA (n = 8 cells). (J) Representative recordings of sIPSC of D2R-MSN of the mice treated with ACSF or KA. (K) Cumulative probability of the amplitudes and the averaged amplitude of sIPSCs of D2R-MSN of the mice treated with ACSF (n = 10 cells) or KA (n = 10 cells). (L) Cumulative probability of the inter-event intervals of sIPSCs and the averaged frequency of sIPSCs of D2R-MSN of the mice treated with ACSF (n = 10 cells) or KA (n = 10 cells).

