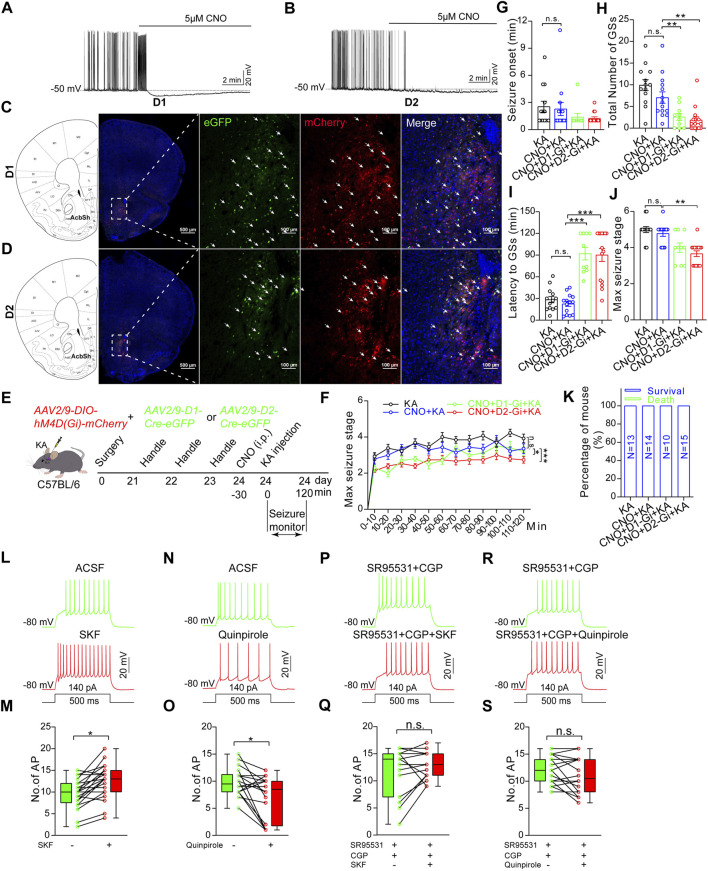
FIGURE 6.
Chemogenetic inhibition of D1R-MSN or D2R-MSN in the NAc shell alleviates TLE seizures. (A) Representative recording shows spontaneous AP firings of D1R-MSN and (B) D2R-MSN transfected with DREADD receptor hM4D (Gi) are suppressed by CNO (5 μM) perfusion. Membrane potential was held under current-clamp at around −50 mV. (C) Representative confocal images show the expression of mCherry and eGFP on D1R-MSN transfected with AAV2/9-DIO-hM4D(Gi)-mCherry and AAV2/9-D1-Cre-eGFP viruses. (D) Representative confocal images show the expression of mCherry and eGFP on D2R-MSN transfected with AAV2/9-DIO-hM4D(Gi)-mCherry and AAV2/9-D2-Cre-eGFP viruses. (E) Schematic diagram of experimental design to examine the effects of chemogenetic inhibition of D1R-MSN or D2R-MSN in the NAc shell on TLE seizures induced by intra-basolateral amygdala (intra-amygdala) microinjection of KA. The mice are allocated into four groups: KA group n = 13 mice; CNO + KA group n = 14 mice; CNO + D1-Gi + KA group n = 10 mice; CNO + D2-Gi + KA group n = 15 mice. (F) Racine’s scaling for maximal seizure stage every 10 min during the whole course of 120 min after KA microinjection. *p < 0.05, ***p < 0.001, F = 18.46, df = 3, two-way ANOVA with repeated-measures. (G) Onset time of the first seizure after KA microinjection. One-way ANOVA. (H) Latency to secondary GSs after KA microinjection. **p < 0.01, one-way ANOVA. (I) Total number of secondary GSs after KA microinjection. ***p < 0.001, one-way ANOVA. (J) Maximal seizure stage in the whole course of 120 min after KA microinjection. **p < 0.01, Kruskal–Wallis H test with Bonferroni correction (K) Mortality rate after KA microinjection. p > 0.05, Kruskal–Wallis H test. (L) Representative recording and statistical data (M) show AP firing in response to a step current before or after perfusion of 15 μM D1R agonist SKF 38393. n = 21 cells, *p < 0.05, Student’s unpaired t-test. (N) Representative recording and statistical data (O) show AP firing in response to a step current before or after perfusion of 15 μM D2R agonist quinpirole. n = 18 cells, *p < 0.05, Student’s unpaired t-test. (P) Representative recording and statistical data (Q) show AP firing in response to a step current before or after perfusion of 15 μM D1R agonist SKF 38393 in the presence of GABAA/B blockers (10 μM SR95531/100 μM CGP35348). n = 15 cells, p > 0.05, Student’s unpaired t-test. (R) Representative recording and statistical data (S) show AP firing in response to a step current before or after perfusion of 15 μM D2R agonist quinpirole in the presence of GABAA/B blockers. n = 20 cells, p > 0.05, Student’s unpaired t-test. In the figures G–K, the statistical differences are compared between the KA group and the CNO + KA group, and between the CNO + KA group and the CNO + D1R-Gi + KA group or the CNO + D2R-Gi + KA group. n.s means not statistically significant.

