Figure 3.
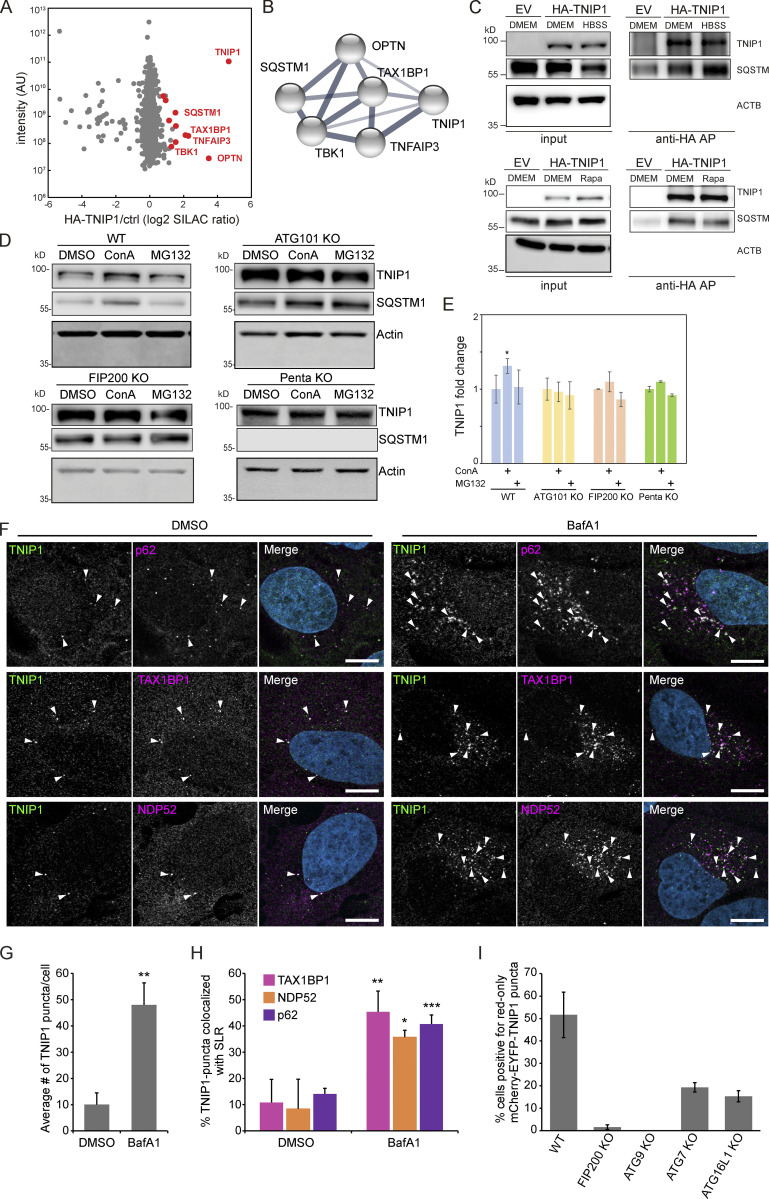
TNIP1 localizes to p62 bodies. (A) HA-TNIP1 affinity purification (AP)-MS highlights its interaction with autophagy receptors. HeLa cells expressing HA-TNIP1 and vector control cells (ctrl.) were differentially SILAC-labeled and anti-HA APs were performed under basal conditions, followed by quantitative MS analyses (n = 3). Proteins that were significantly enriched in minimum two out of three replicates are highlighted in red (P < 0.05, BH corrected). Proteins with known functions in autophagy and inflammation are annotated. (B) TNIP1 interactome. STRING DB was used to highlight the TNIP1 interactome identified in A (Szklarczyk et al., 2019). Thickness of edges indicate confidence of interaction. (C) TNIP1 interacts with p62/SQSTM1. Anti-HA affinity purifications followed by Western blot analyses were performed to test for HA-TNIP1-p62/SQSTM1 interactions as identified in A in basal (DMEM), stress conditions (amino acid starvation, HBSS) and after rapamycin (Rapa) treatment each for 4 h. EV, empty vector. (D and E) TNIP1 is degraded in an autophagy- and SLR-dependent manner. Shown are representative blots of three biological replicates. HeLa WT cells, ATG101 KO cells, FIP200 KO cells and PentaKO cells were treated with 10 μM MG132 or 2 nM ConA for 4 h. TNIP1 abundance was significantly increased in ConA-treated HeLa WT cells, while treatment had no effect in HeLa ATG101 KO, FIP200 KO, and pentaKO cells. E shows quantifications of D (n = 3). * = P < 0.05, unpaired, two-sided t test. Error bars indicates SEM. (F) U2OS cells were treated with either vehicle (DMSO) or BafA1 for 5 h and stained for endogenous TNIP1 (green) together with either endogenous p62, NDP52 or TAX1BP1. Representative images are shown. Colocalization between TNIP1 and respective SLRs are indicated by arrowheads. Scale bars, 10 µm. (G) Quantification of the average number of TNIP1 puncta per cell imaged in F (>40 cells analyzed for each condition within each replicate [n = 3]). ** = P < 0.01, unpaired two-sided t test. Error bars indicate SD. (H) Quantification of percent TNIP1 puncta colocalizing with the indicated SLRs in F (>40 cells analyzed for each condition within each replicate [n = 3]). *** = P < 0.001, ** = P < 0.01, * = P < 0.05, unpaired, two-sided t test. Error bars indicate SD. (I) Transient transfection of mCherry-EGFP-TNIP1 in WT U2OS cells and indicated KO cell lines. The graph bars indicate the percentage of transfected cells containing >5 red-only puncta indicative of autophagic degradation. Each graph bar shows the mean value from three separate transfections (n = 3, >100 cells counted per transfection, unpaired, two-sided t test). Error bars indicate SD. In E and G–I, data distribution was assumed to be normal, but this was not formally tested. Source data are available for this figure: SourceData F3.

