
Figure 4.
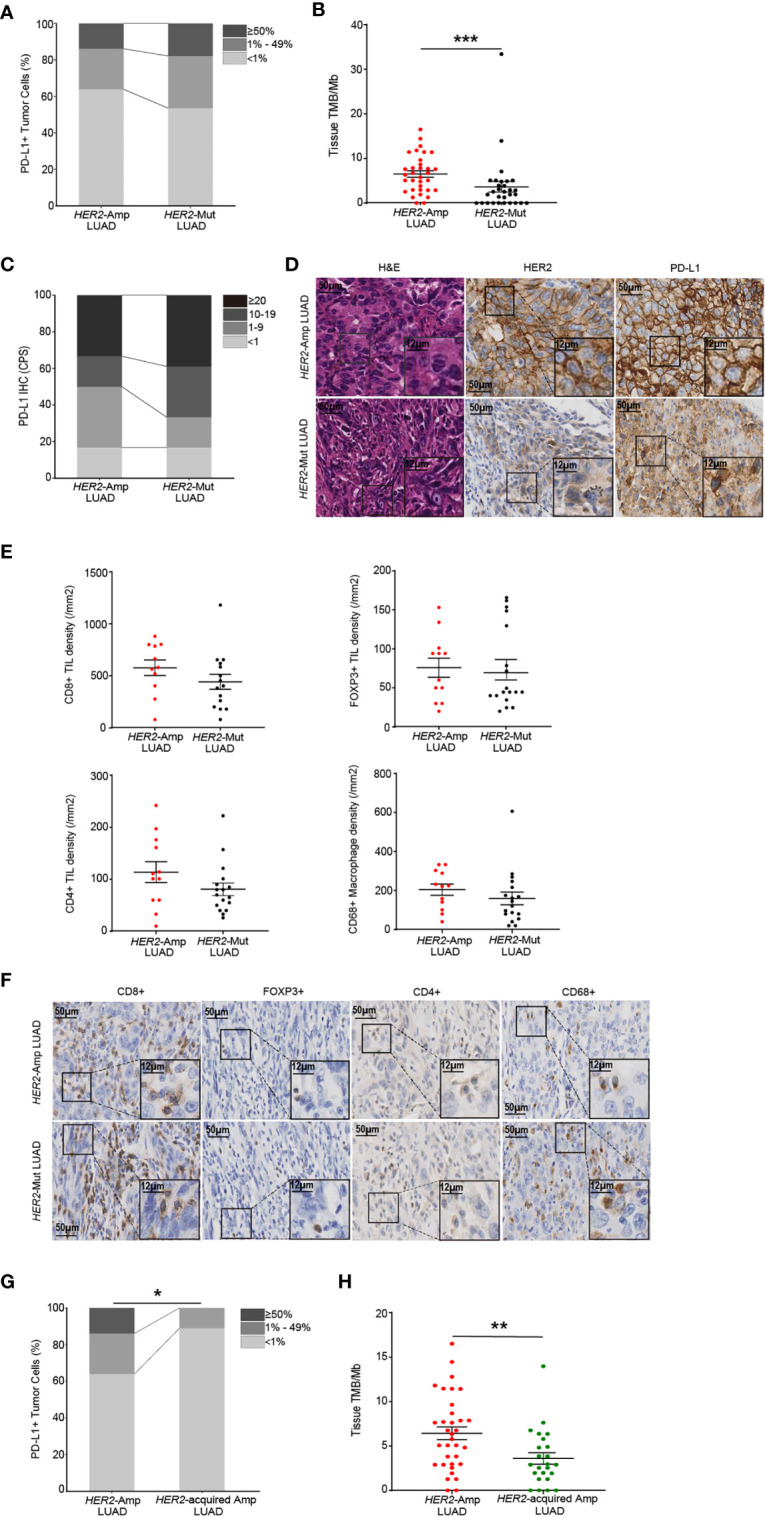
The immunogenicity and TIME in HER2-aberrant LUAD. (A, B) Difference in PD-L1 expression on tumor cells (A) and the level of TMB (B) between amplification and mutation. (C, D) Statistical results (c) and images (D) of PD-L1 expression evaluated by CPS. (E, F) Densities of CD8+, POXP3+ and CD4+ lymphocytes, and CD68+ macrophages (E) between LUAD patients with HER2 amplification (n=12) and mutation (n=18). Corresponding IHC images are shown in (F). Note: The paraffin section of 3 patients with HER2-mutant LUAD failed the quality control after CD8 IHC staining and were not included in the statistical analysis. 1 patient with HER2-mutant LUAD was not included after CD4 IHC staining because of the same problem. (G, H) The PD-L1 (G) and TMB (H) levels in LUAD patients with HER2 amplification and acquired HER2 amplification. P < 0.05 was regarded as significantly different. ***P < 0.001, **P < 0.01, *P < 0.05.