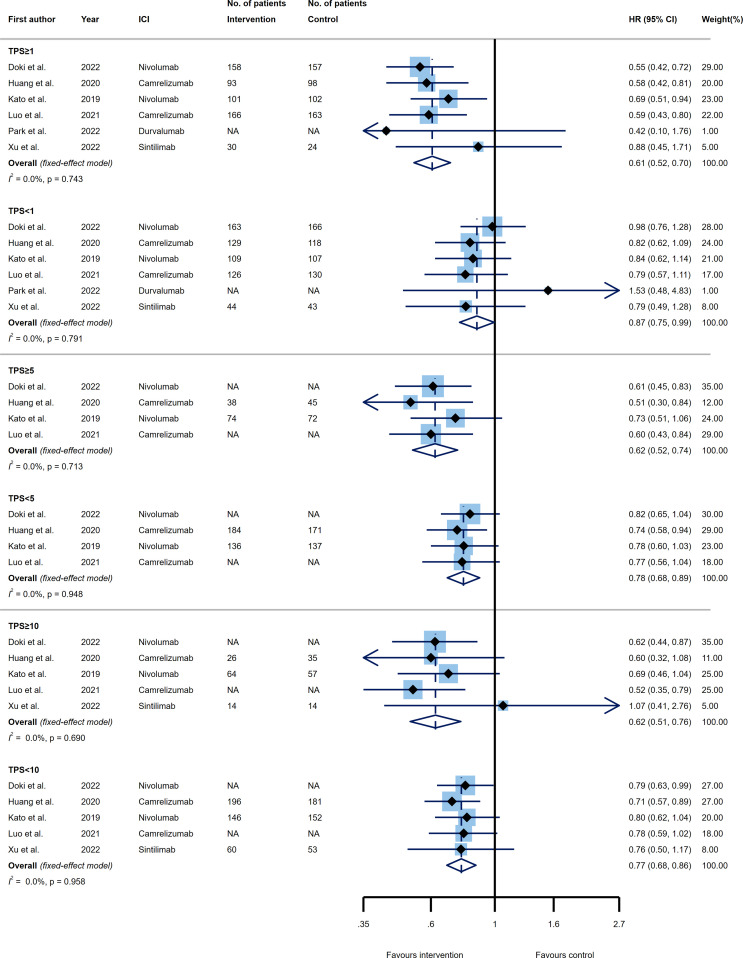
Figure 4.
Forest plots of overall survival (OS) in PD-L1 high expression group vs. PD-L1 low expression group for the thresholds of tumor proportion score (TPS)=1% (upper panel), TPS=5% (middle panel), and TPS=10% (lower panel). The squares indicate weight of each study based on the fixed or random‐effect model. The vertical dashed line indicates the overall pooled estimate and the diamond the 95% confidence interval around that pooled estimate. The forest plot was generated using STATA 17.0 (STATA Corp, LLC, TX).

