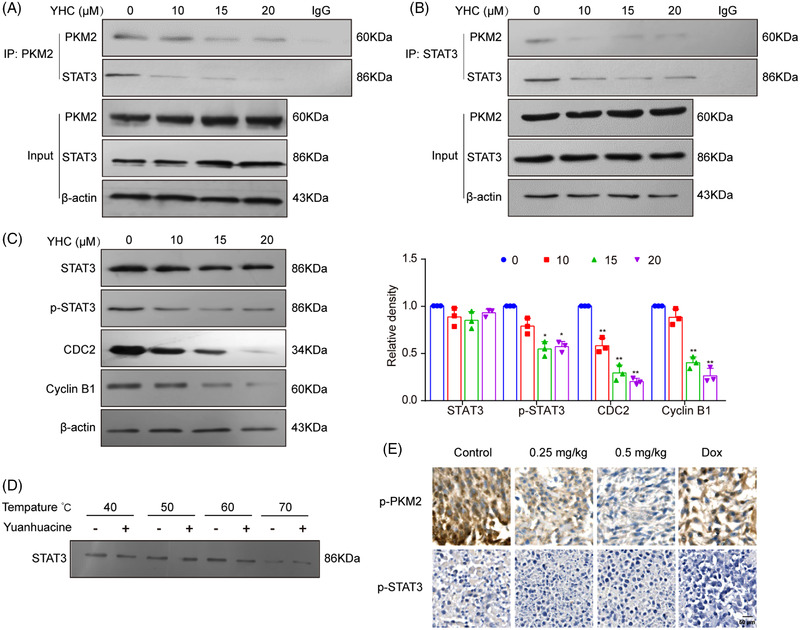
FIGURE 3.

YHC disrupted interactions of PKM2 and STAT3 in breast cancer cells. (A and B) Cells were treated with 0, 10, 15 and 20 μM of YHC for 48 h. The co‐immunoprecipitation assay was used to detect the protein–protein interaction between PKM2 and STAT3. (C) The protein expressions of STAT3, p‐STAT3 (Y705), CDC2 and Cyclin B1 were detected by Western blot assay. (D) CETSA assay was applied to detect the stabilisation between YHC and STAT3 at different temperatures. Statistical analysis was performed on the data as the mean ± SD (n = 3). (E) YHC could decrease p‐PKM2 and p‐STAT3 expression in tumour tissues by immunohistochemistry assay. Statistical analysis was performed on the data as the mean ± SD (n = 5). *p < .05, **p < .01 versus control group.
