
Figure 3.
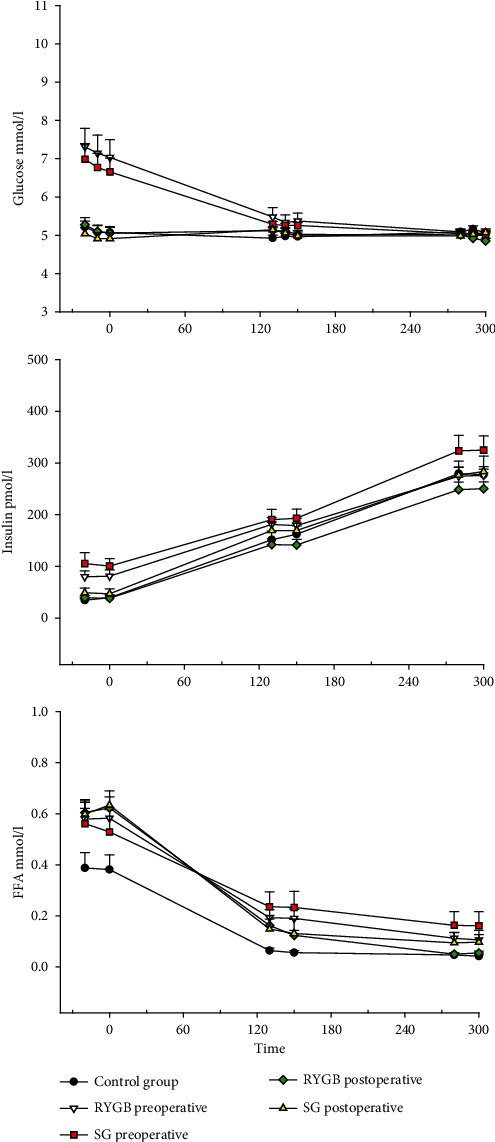
Glucose, insulin, and free fatty acids during the basal period and two-step hyperinsulinemic euglycemic clamp. Displayed as the mean with the standard error of the mean. p values < 0.05 are considered statistical significant. ∗Significant difference from the control group. ∗∗Significant difference between post- and preoperative values within each group. ∗∗∗Significant difference between RYGB and SG. Abbreviations: FFA: free fatty acids.