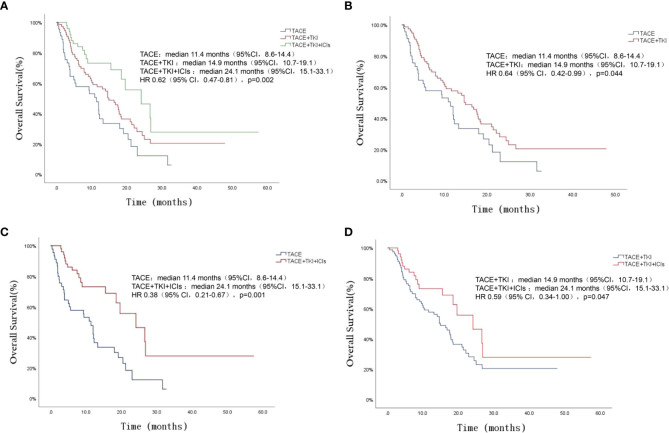
Figure 1.
Kaplan-Meier survival curves showing OS stratified by treatment options in patients of uHCC. Comparison of OS among the three groups of patients (A). OS comparison between TACE group and TACE+TKI group (B). OS comparison between TACE group and TACE+TKI+ICIs group (C). OS comparison between TACE+TKI group and TACE+TKI+ICIs group (D).

