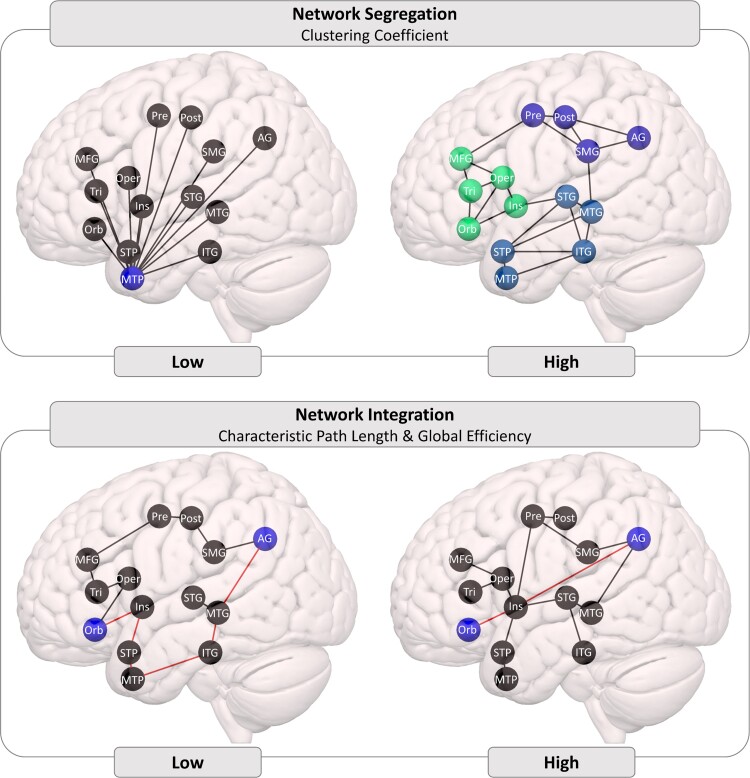
Figure 1.
Schematic illustrations of connectivity differences derived from graph theory. Top: high clustering coefficient (shown on the right) indicates more densely interconnected sub-networks than low clustering coefficient (shown on the left). Bottom: high network integration indicates that, on average, fewer steps are needed for information to get from one node to any other node. The AG-Orb path is an illustrative example: in the low integration case (shown on the left), a minimum of six steps is required, in the high integration case (shown on the right), only two steps are required. Note: these are schematic illustrations to clarify the graph theoretic measures of connectivity, they do not reflect claims about patterns of connectivity among specific brain regions.

