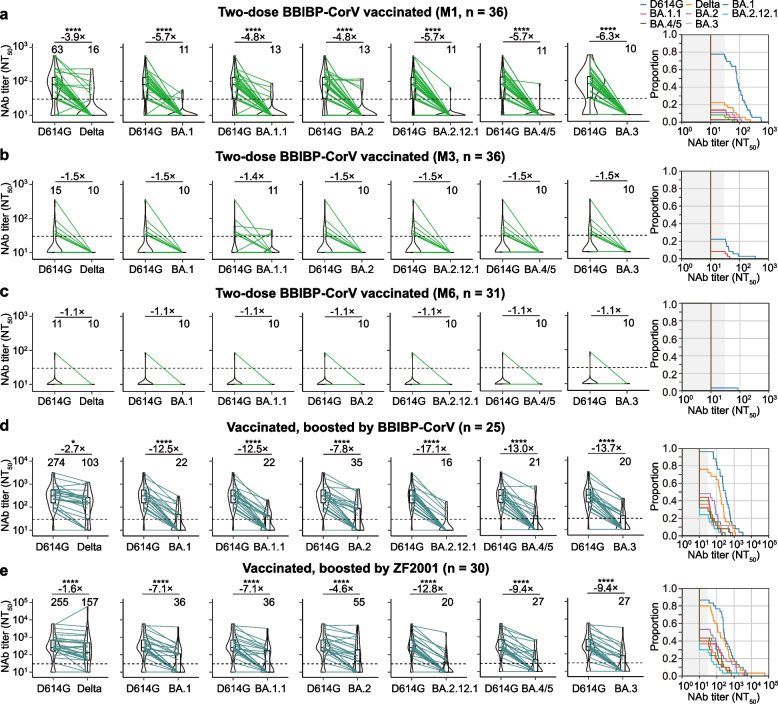
Fig. 1.
Neutralizing antibody levels in vaccinated individuals with or without booster vaccination. a–c Box-violin plots showing the median neutralizing antibody titers against the SARS-CoV-2 D614G, Delta, and Omicron subvariants in vaccinated, unboosted individuals approximately 1 month (M1) (a), 3 months (M3) (b), and 7 months (M7) (c) after the second dose vaccination of BBIBP-CoV (left), along with cumulative distribution function plots of titers against D614G, Delta, and Omicron subvariant (right), showing the proportion of samples at or above a given titer. d, e Box-violin plots of titers against the SARS-CoV-2 D614G, Delta, and Omicron subvariants in BBIBP-CoV booster vaccinated (d) and ZF2001 booster vaccinated (e) individuals (left), along with cumulative distribution function plots of titers against D614G, Delta, and Omicron subvariant (right), showing the proportion of samples at or above a given titer. For the box-violin plots, the median is represented by the thick black line inside the box. The geomatic mean titers (GMTs) are shown above each column. The fold change in GMT is displayed in a–e. The horizontal dotted line represents the limit of detection of 30. A two-tailed Friedman test with a false discovery rate for multiple comparisons was performed to compare Delta and Omicron subvariants to D614G in a–e. p values are represented as *p < 0.05, ***p < 0.001, and ****p < 0.0001. No asterisk indicates no statistical significance.

