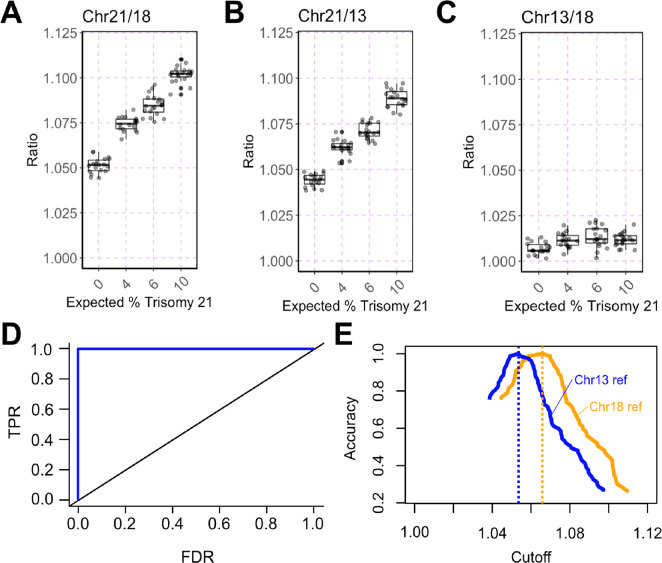
Figure 6.
UltraPCR NIPT assay analytical study. (A–C) Boxplot of different chromosomal ratios. Chr21/18 and Chr21/13 are expected to increase with more %T21 spiked in, and Chr13/18 is expected to remain constant. (D) ROC curve using all spiked %T21 samples compared to 0% to determine the optimal threshold to separate control versus T21-spiked samples. (E) Accuracy plot vs cutoff where the blue line represents data using Chr13 as a reference chromosome and the orange line represents data using Chr18 as a reference chromosome. Dotted lines represent their respective optimal cutoff to maximize accuracy of the assay.

