Figure 5.

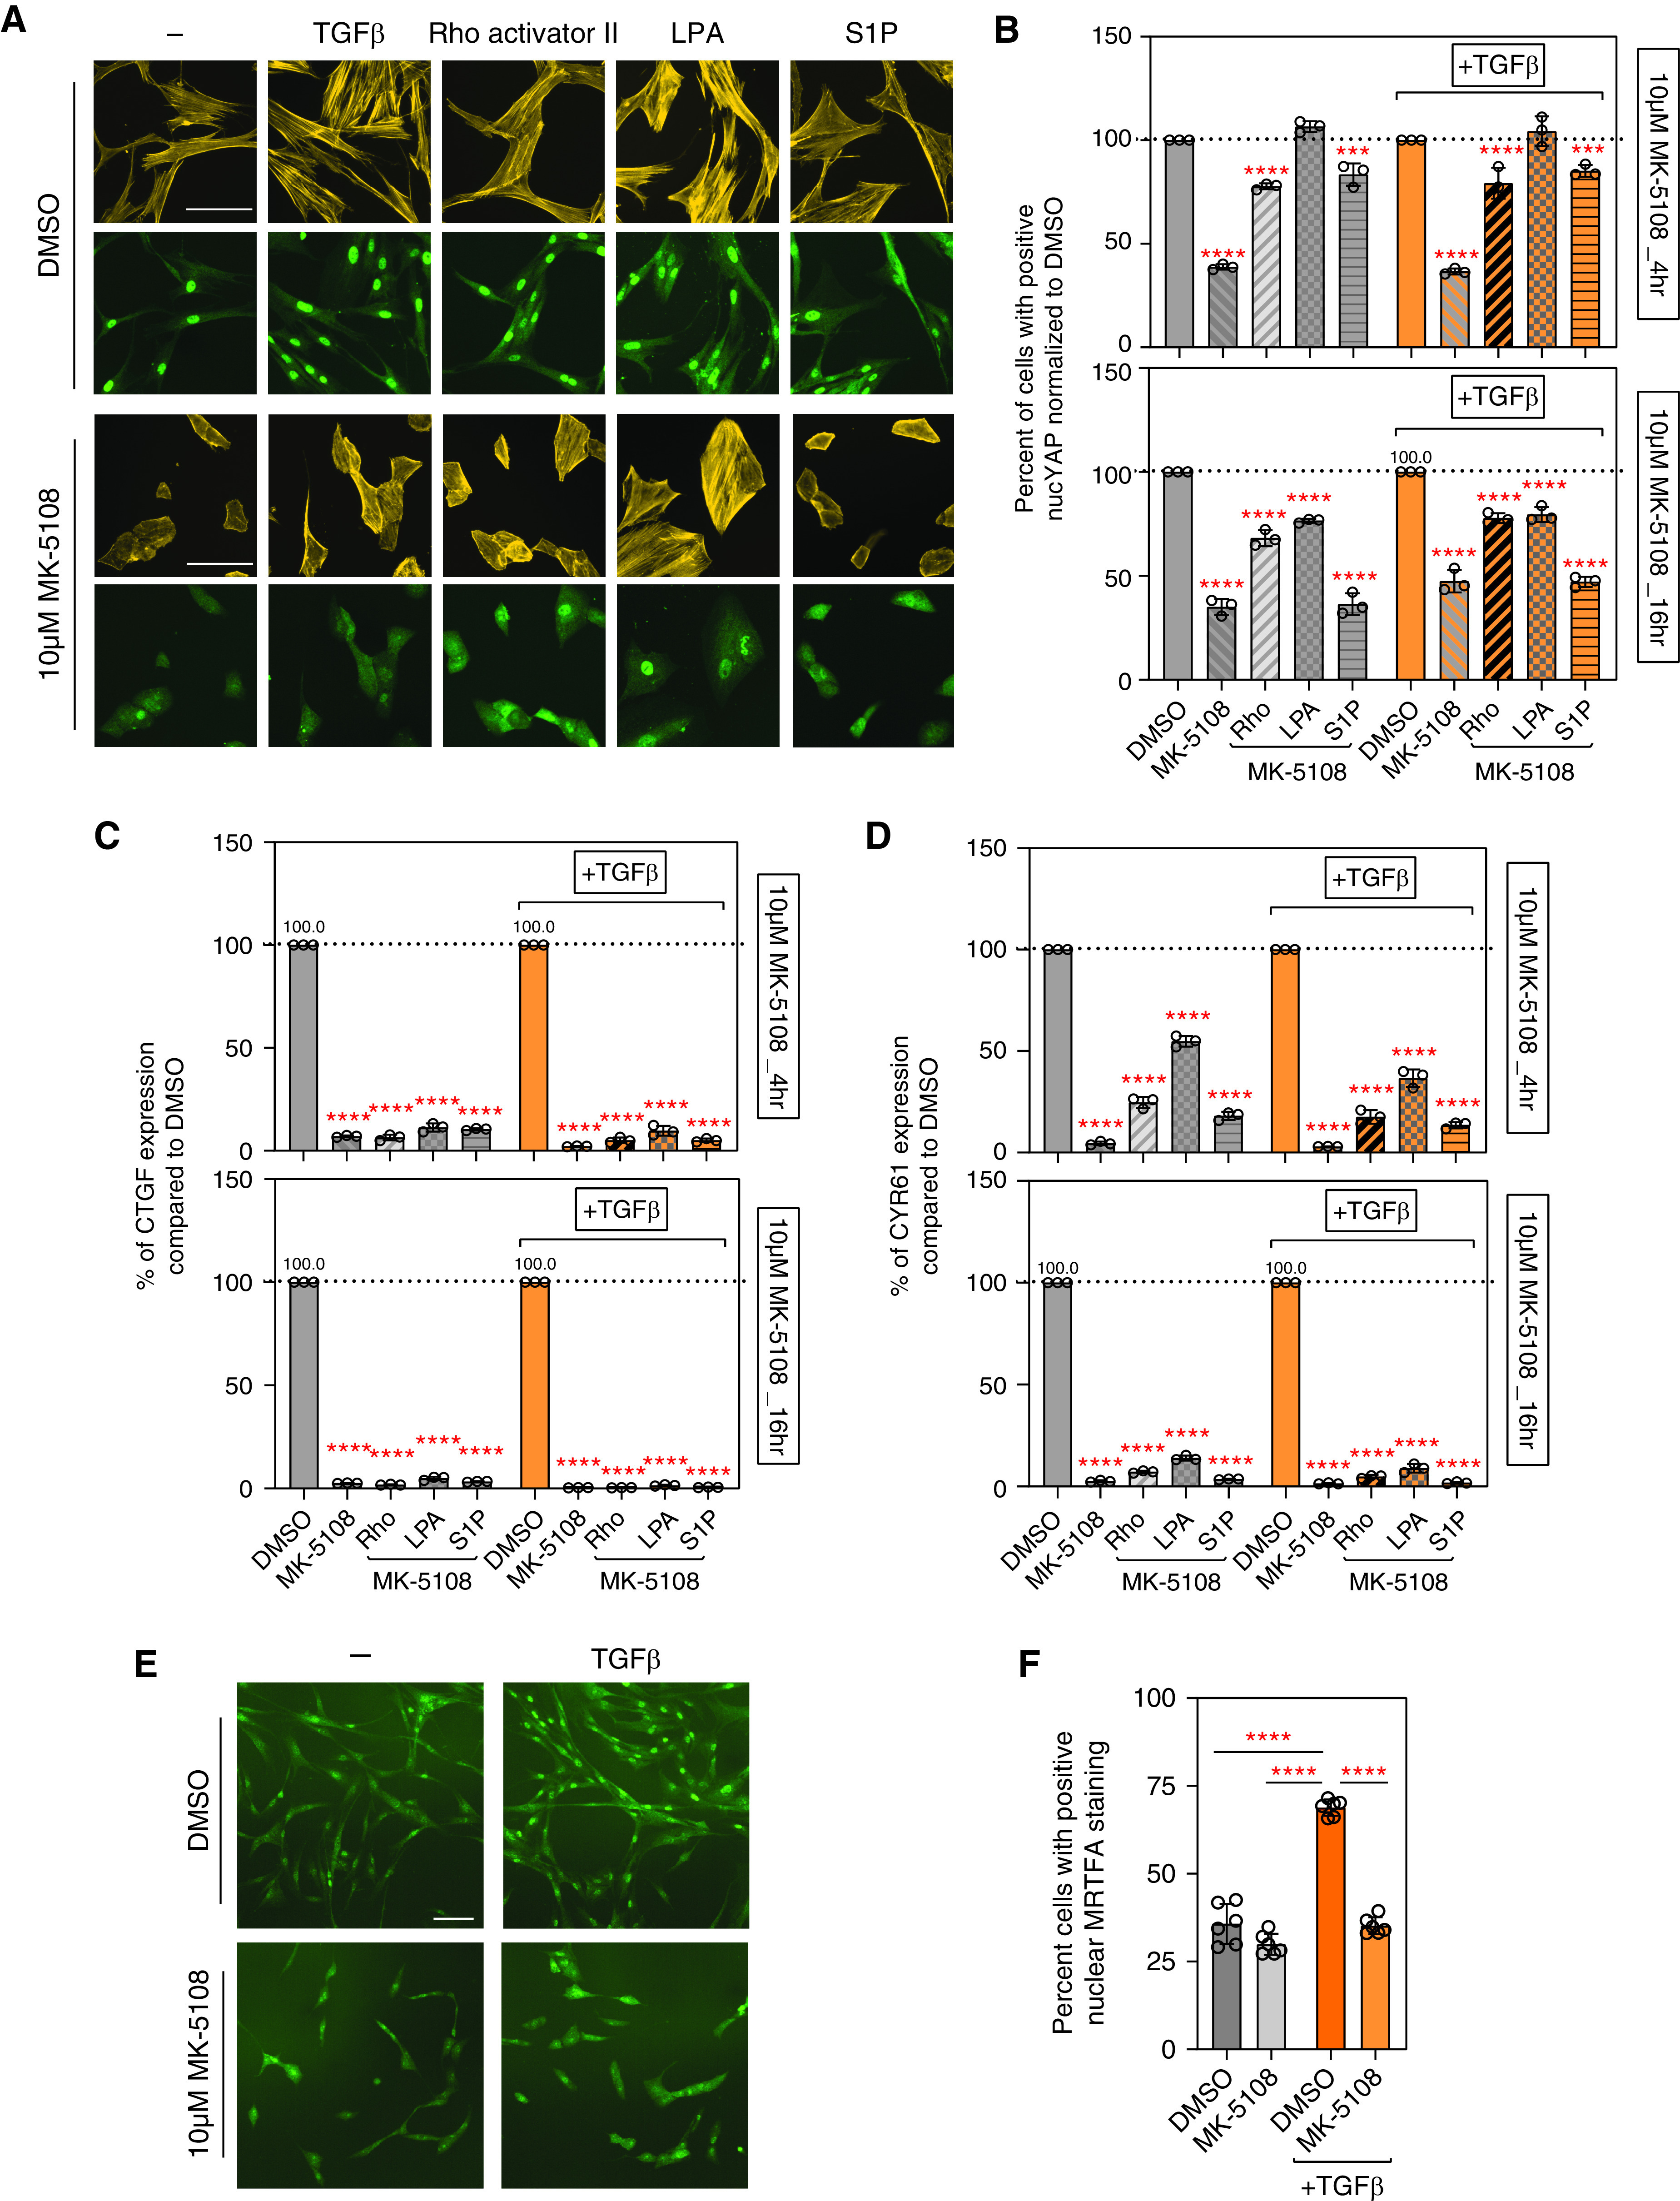
Aurora A inhibition inactivates YAP and decreases fibrotic gene expression partly through regulating actin polymerization. (A) Rhodamine phalloidin (yellow) and YAP (green) fluorescent images showing F-actin fibers and YAP localization after treating HLFs with DMSO or MK-5108, combined with TGFβ (5 ng/ml), Rho activator II (0.5 μg/ml), lysophosphatidic acid (LPA) (10 μM), or sphingosine 1-phosphophate (S1P) (1 μM) treatment. Scale bars, 10 μm. (B) Quantification of YAP nuclear localization in A. Percentage of cells with positive nuclear YAP staining normalized to control are shown as percentage of control value. Data represent mean ± SD, n = 3. ****P < 0.0001 and ***P < 0.001, one-way ANOVA with Sidak’s multiple comparisons test. (C and D) Profibrotic genes CTGF and CYR61 expression at 4 hours or 16 hours normalized to DMSO shown as percentage of control value, after treating HLFs with 10 μM MK-5108 alone or combined with TGFβ and Rho activator II, LPA, or S1P. Data represent mean ± SD, n = 3. ****P < 0.0001, one-way ANOVA with Sidak’s multiple comparisons test. (E) Fluorescent images (scale bar, 10 µm) and (F) quantifications showing MRTFA (Myocardin-Related Transcription Factor A) localization after treating HLFs with DMSO or MK-5108, combined with TGFβ (5 ng/ml). Scale bar, 10 μm. Data represent mean ± SD, n = 6. ****P < 0.0001, unpaired t test.
