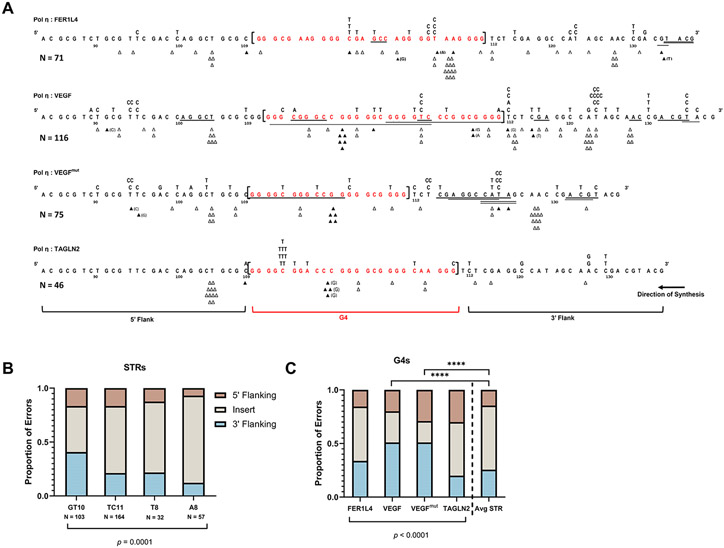
Figure 4. G4 Motifs Influence Pol η Errors in Flanking Sequences.
(A) Pol η error spectra for each indicated G4 containing substrate. G4 sequence is shown in brackets, red. The surrounding HSV-tk sequence is shown for 5’ and 3’ flanking windows (windows set as the average G4 length, 27 nt). Δ = single base deletion event, ▲ = single base insertion event (inserted base in parentheses if non-templated); Underline = deletions >1nt; substituted bases above each line of sequence. For TAGLN2, two independent errors are not shown here. Errors that could not be unambiguously assigned to one window were not counted for this analysis. (B-C) Distribution of pol η errors within each insert or flanking tk sequence window (5’ vs 3’).. Tandem mutations were counted as independent errors. (B) Microsatellite (STR) insert distributions (data from 4, 43, 53). (C) G4 insert distributions. Chi-square (X2) analysis performed on error counts with p-value indicated. Each G4 in (C) also was compared to the average STR and analyzed by Chi-square (**** p<0.0001). For full pol η and G4 mutational spectra, see Figures S3-S6. N = total error count of 1-2 independent reactions for STRs and 2-4 independent reactions for G4s.

