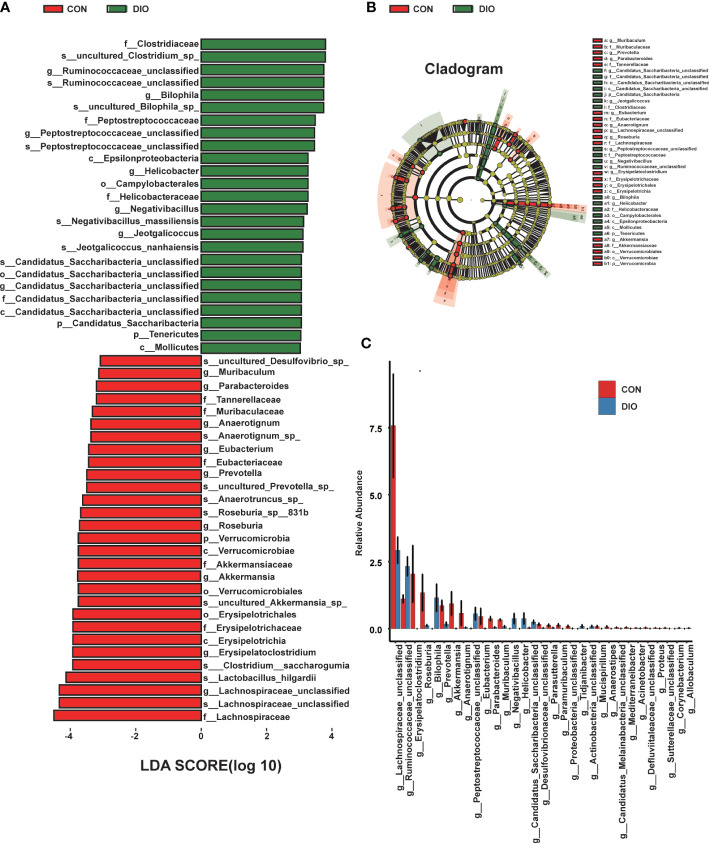
Figure 4.
DIO changes the gut microbiota from the phylum to species levels. (A) LEfSe analysis of gut microbiota in the CON and DIO groups, n = 6, LDA score > 4.0. Red represents increased microbiota in the CON group; green represents increased microbiota in the DIO group. (B) The relationships among different microbiota from the phylum to species levels are shown in the cladogram, n = 6. (C) Significant difference analysis at genus level, n = 6, Wilcox test P-value < 0.05.

