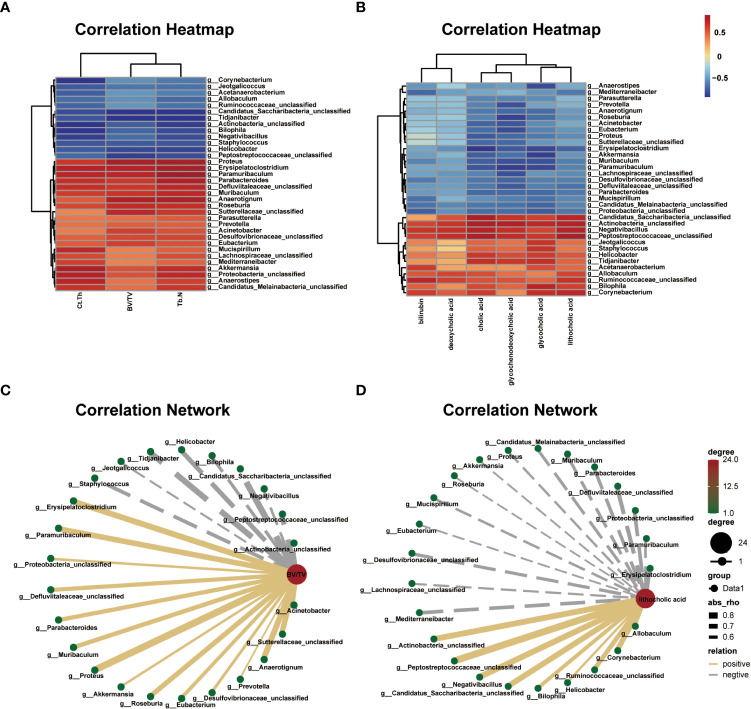
Figure 6.
Correlations among differential gut microbial genera, bone phenotypes, and fecal metabolites related to bile acid metabolism. (A) Correlation heat between differential bacterial genera and bone phenotypes in the two groups, |r| > 0.5. Red represents positive correlations, and blue represents negative correlations. The darker the color, the stronger the correlation. (B) Correlation network map between BV/TV and differential bacterial genera, |r| > 0.5. (C) Correlation heat map between the differential bacterial genera and fecal metabolites related to bile acid metabolism in the two groups, |r| > 0.5. Red represents positive correlations, and blue represents negative correlations. The darker the color, the stronger the correlation. (D) Correlation network map between lithocholic acid (LCA) and differential bacterial genera, |r| > 0.5.

