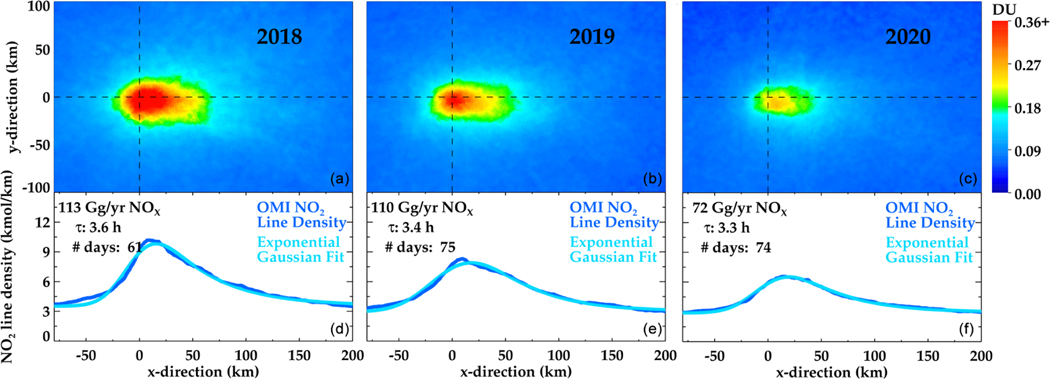
Figure 5.
Five-month averaged (May–September) top-down NOx emission estimates for the New York metropolitan area, for 2018 (a, d), 2019 (b, e) and 2020 (c, f). TROPOMI NO2 data is rotated based on daily wind direction. (d), (e), and (f) show the TROPOMI NO2 line densities, which are integrals along the y axis ±50 km about the x axis. The statistical EMG fit to the top-down line densities is shown in light blue.

