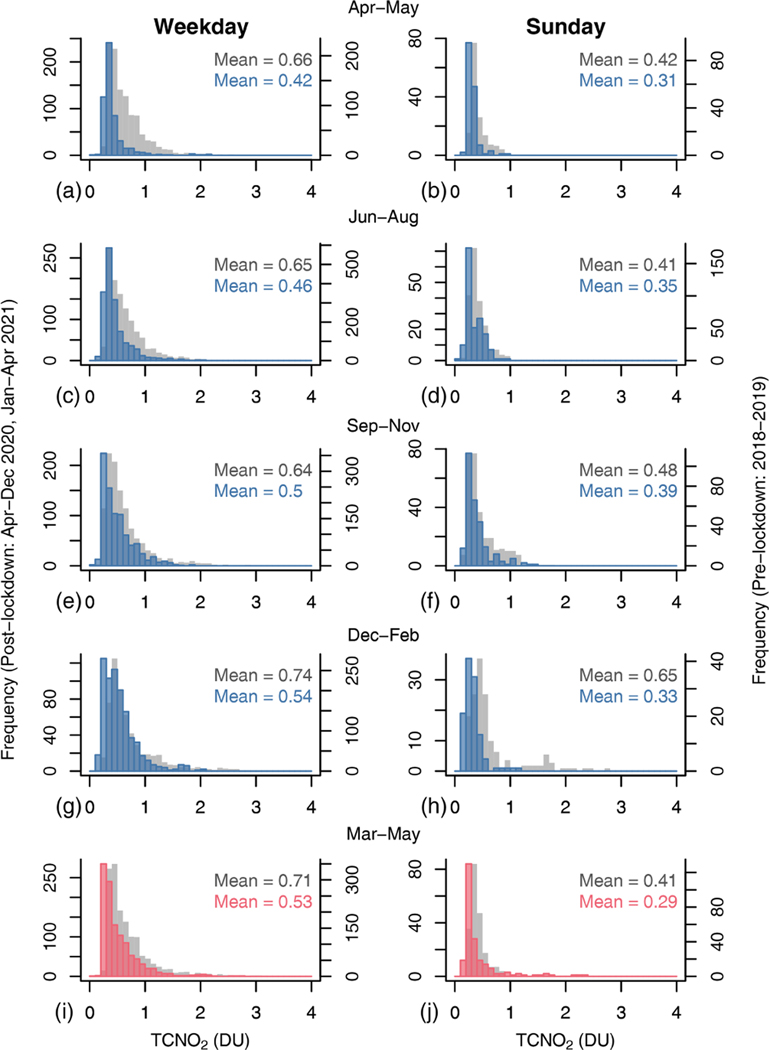
Figure 6.
Histogram of TCNO2 measured in Upper West Manhattan by PSI#135 for pre-lockdown (gray, 2018–2019) and post-lockdown winter (blue) and post-lockdown spring (pink) conditions. Results are shown for weekdays (left column) and Sunday (right column) across seasons from April 2020–May 2021. The mean NO2 pre- and post-lockdown is also shown.

