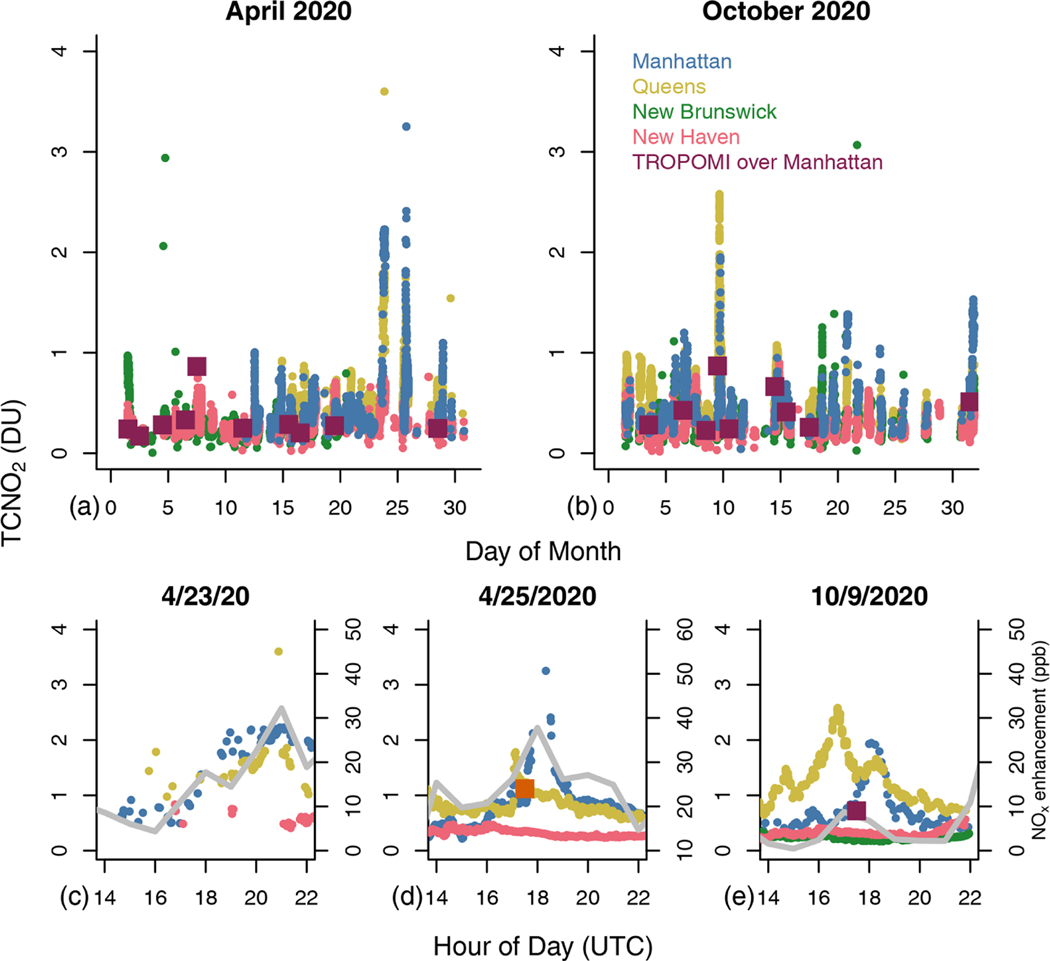
Figure 8.
Despite the decline in traffic and physical distancing restrictions, cases of high NO2 pollution (TCNO2 > 1.8 DU) were observed in the New York metropolitan area during and post the COVID-19 lockdown. TCNO2 measurements are shown here for (a) April 2020 and (b) October 2020, from Pandora systems in Manhattan, Queens, New Brunswick, and New Haven, and TROPOMI over Manhattan. Diurnal dynamics in TCNO2 during specific days of exceedances are shown for (c) 23 April, (d) 25 April (square indicates OMI TCNO2 over Manhattan), and (e) 9 October 2020. The EDGAR power-sector near-surface NOx concentration enhancements in Manhattan are shown by the gray line in (c)–(e).

