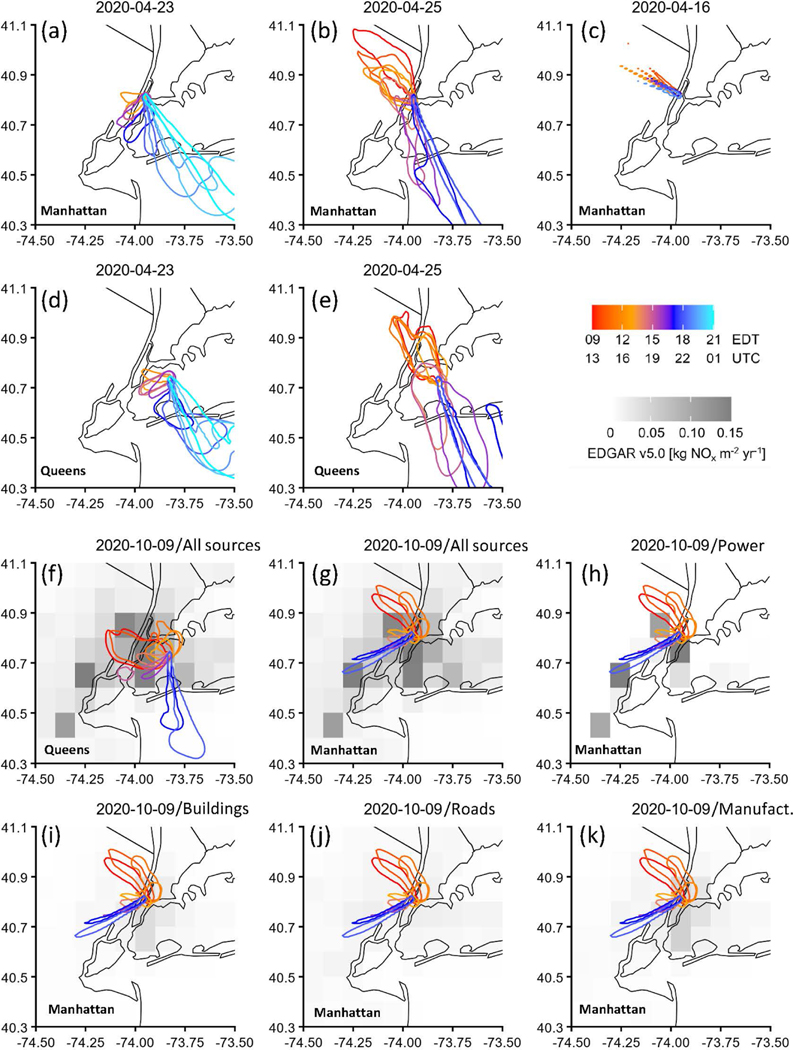
Figure 9.
Twenty-four hour total STILT surface influence contours for total column NO2 exceedances on 23 April (a, d), 25 April (b, e), and 9 October (f–k) and a low NO2 case on 16 April 2020 (c), for comparison. Contour lines represent surface influence of 1ppb (μmolm−2 s−1)−1 and are colored by hour-of-day of the receptor. October 9 is overlaid with EDGAR inventories of NOx for 2015 (kgNOx m−2 yr−1). The area encircled by each contour indicates the region of emissions that reaches the Manhattan and Queens observation sites for a given time and day.

