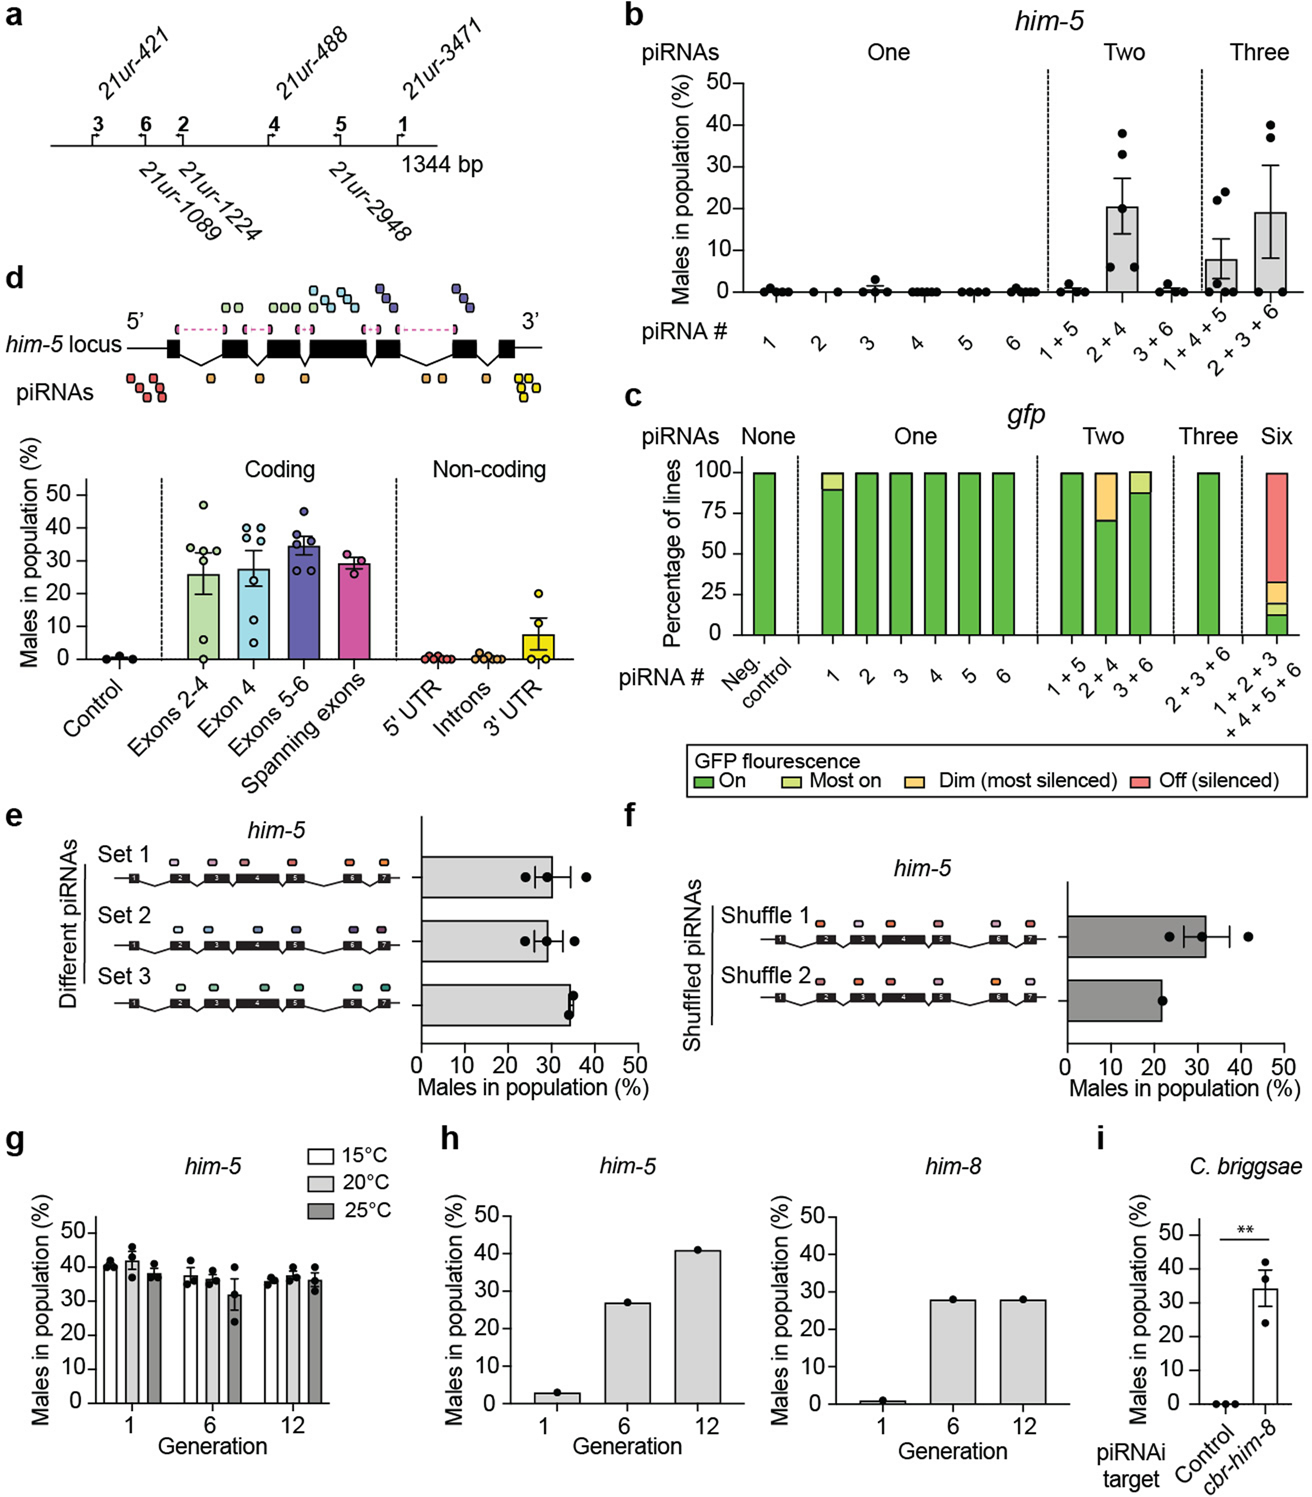
Extended Data Fig. 2 |. Rules for efficient piRNA silencing.

a. Schematic of sg-piRNA clusterE. b. Graph showing the effect of silencing him-5 with one, two, or three sg-piRNAs recoded in clusterE. c. Bar graph showing the effect of silencing a codon-optimized gfp expressed in the germline (Pmex-5::gfp) with zero, one, two, three, or six sg-piRNAs from clusterE. Independent biological strains (at least 11 animals per strain) were scored qualitatively on a dissection microscope blinded to genotype. d. Top. Schematic of the him-5 (D1086.4a.1) gene structure and the location of sg-piRNAs. Bottom. piRNAi using clusterE targeting him-5 exons or 5’ and 3’ untranslated regions (UTRs) or introns (‘non-coding’). Control = randomized sg-piRNAs. e. Three versions of piRNA clusterE using different sg-piRNAs were tested for him-5 silencing. Set 1 corresponds to Fig. 1b and the piRNAi transgenes in set 2 and set 3 target the same exons as set 1 but use different sg-piRNAs. f. The six sg-piRNAs in ‘set 1’ were shuffled (‘shuffle 1’ and ‘shuffle 2’), so each sg-piRNA was expressed by a different promoter in the piRNA cluster. The guide piRNA target locations in the him-5 transcript are shown as colored ovals. The strains were cultured at 25 °C. g. Transgenic animals were tested for him-5 silencing by piRNAi (piRNA clusterE) over 12 generations at various temperatures (15 °C, 20 °C, 25 °C). h. Propagation of two transgenic animals with sg-piRNAs targeting him-5 (left) and him-8 (right) that initially had a low frequency of males in the population. The two strains were propagated for 12 generations, and the male frequency was quantified every six generations. i. C. elegans piRNA clusterE targeting the gene cbr-him-8 in C. briggsae (AF16). Control (‘−’) = un-injected C. briggsae. Two-tailed t-test with Welch’s correction. ** P = 0.0236. Data are presented as mean values+/− SEM with each data point corresponding to an independently derived transgenic strain. Sample sizes (b) n = 5 (‘1’), n = 2 (‘2’), n = 4 (‘3’), n = 6 (‘4’), n = 4 (‘5’), n = 6 (‘6’), n = 4 (‘1 + 5’), n = 5 (‘2 + 4’), n = 4 (‘3 + 6’), n = 6 (‘1 + 4 + 5’), n = 4 (‘2 + 3 + 6’), (c) n = 4 (Neg. control), n = 6 (‘1’), n = 8 (‘2’), n = 10 (‘3’), n = 9 (‘4’), n = 7 (‘5’), n = 10 (‘6’), n = 8 (‘1 + 5’), n = 7 (‘3 + 4’), n = 5 (‘5 + 6’), n = 2 (‘2 + 3 + 6’), (d) n = 3 (control), n = 6 (Exons 2–4), n = 6 (exon 4), n = 5 (exons 5–6), n = 3 (spanning exons), n = 6 (5’ UTR), n = 6 (introns), n = 4 (3’ UTR), (e) n = 3 (set 1), n = 3 (set 2), n = 2 (set 3), (f) n = 3 (shuffle 1), n = 1 (shuffle 2), (g) n = 3 (all conditions), (h) n = 1 (all conditions), n = 3 (control), n = 3 (cbr-him-8) biologically independent transgenic strains.
