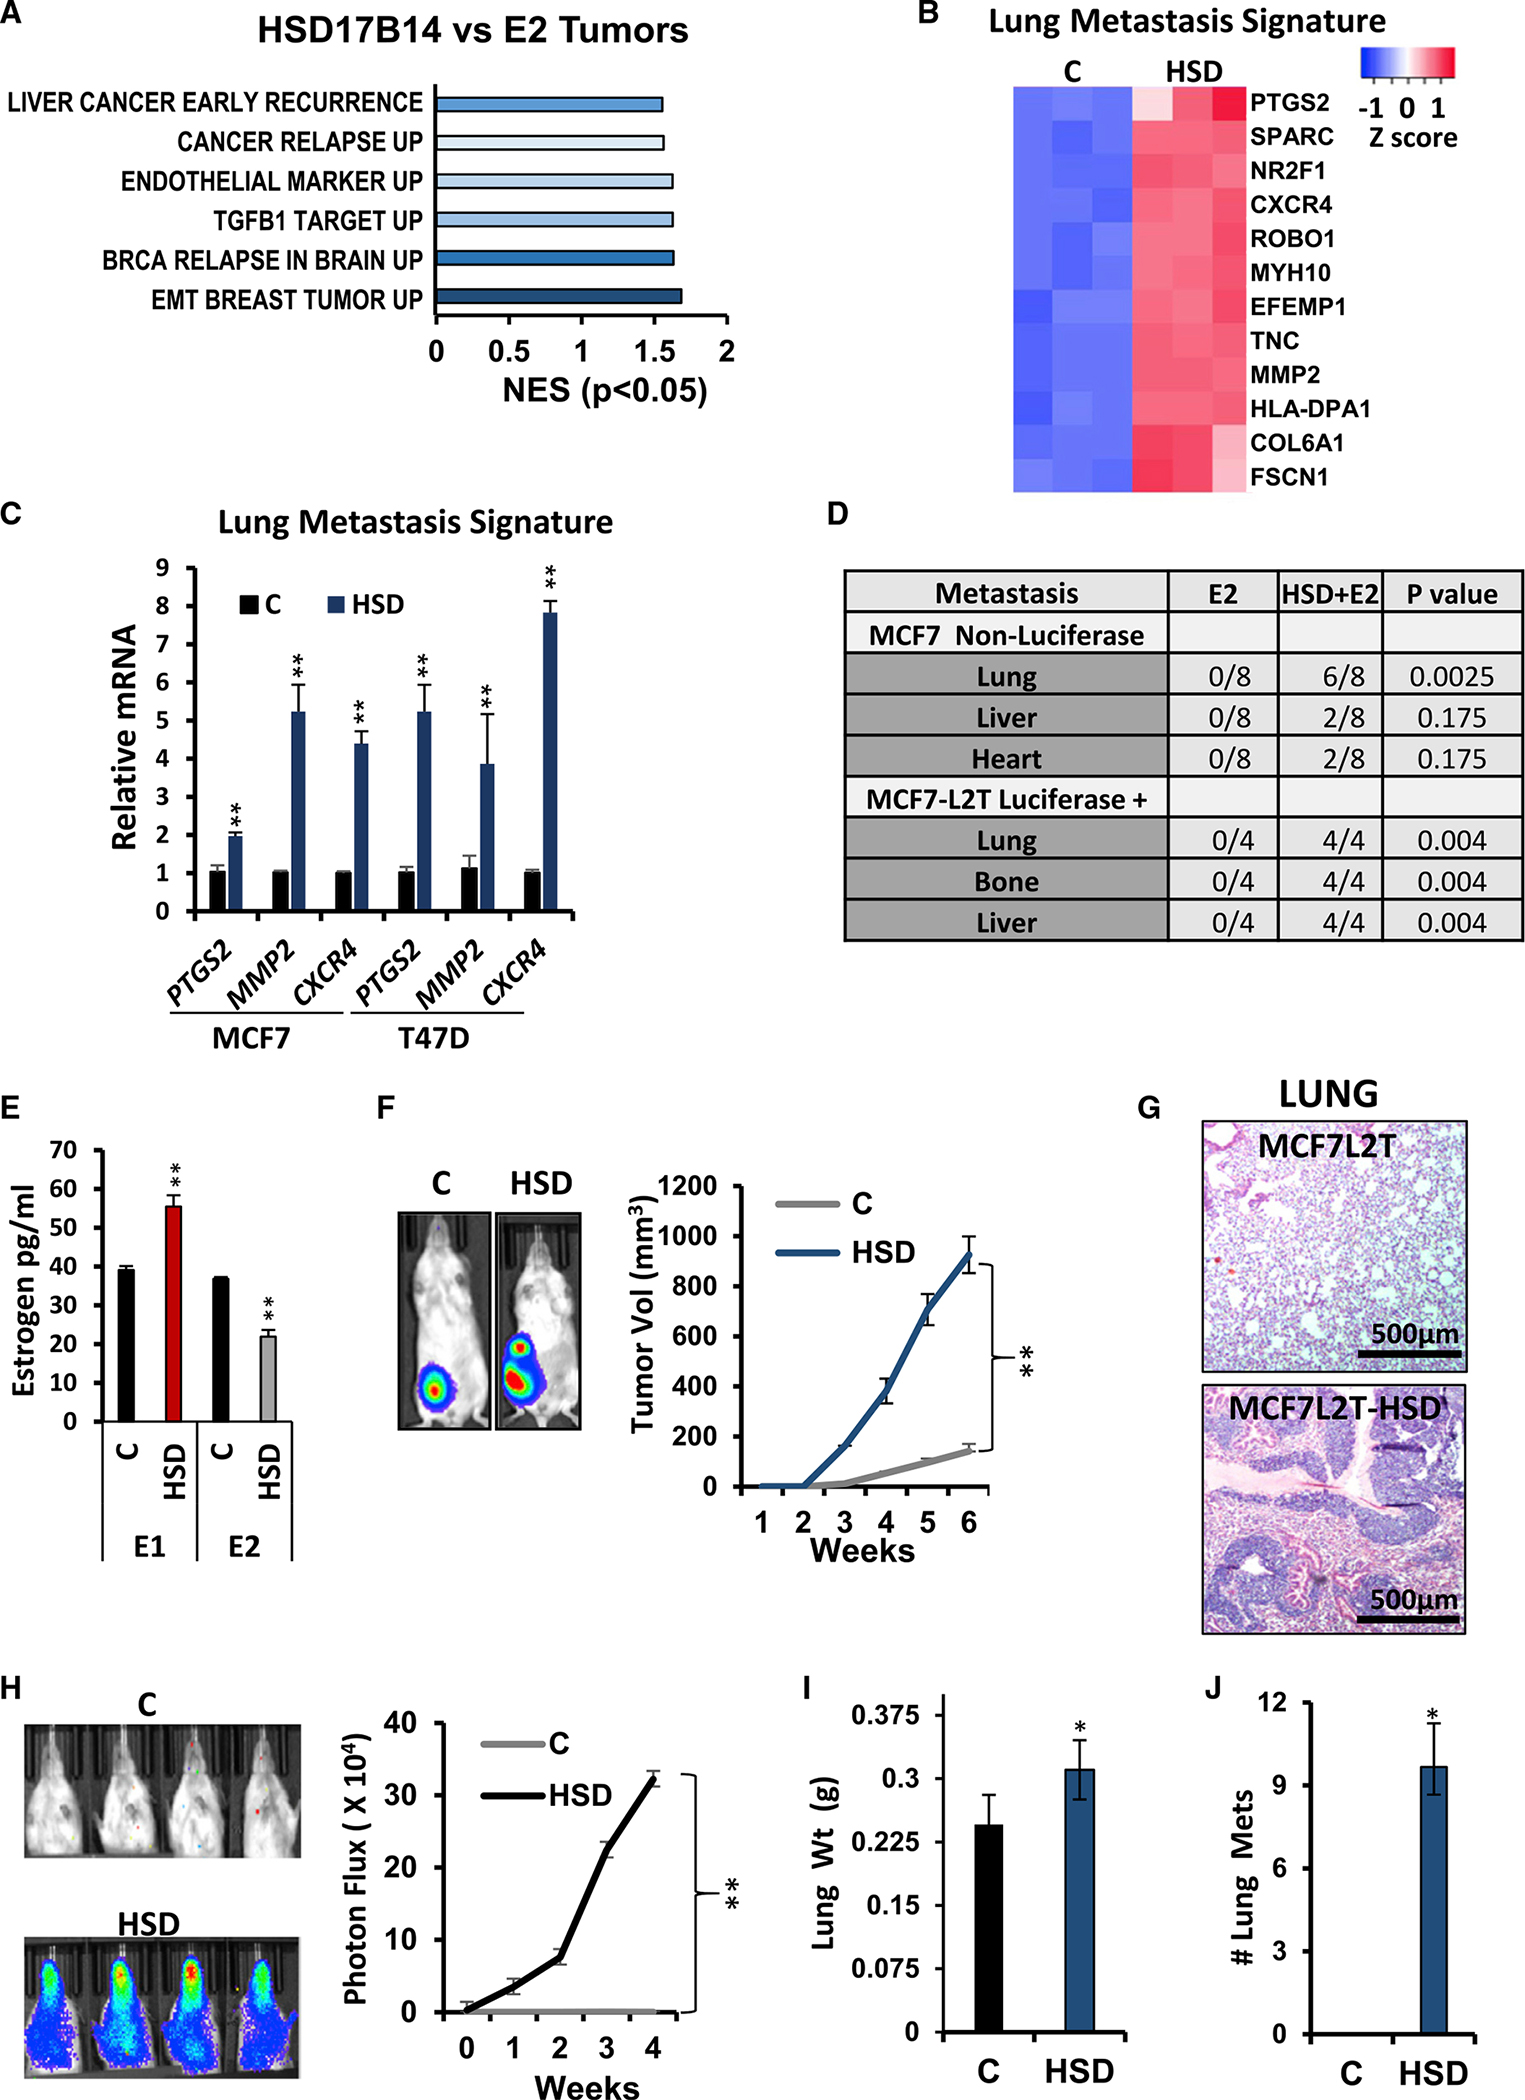
Figure 4. HSD17B14 increases intracellular E1:E2 ratio, leading to multi-organ metastasis.

(A) GO analysis of differentially expressed genes in E2-treated mice injected with MCF7HSD (HSD17B14) or MCF7 control (E2 tumors) (n = 3 tumors).
(B) MCF7HSD shows high expression of breast cancer lung metastasis signature genes (n = 3 tumors).
(C) qPCR validates overexpression of lung metastasis mediators in HSD17B14 (HSD) overexpressing MCF7 and T47D compared with vector controls (n = 3 tumors).
(D) Table showing numbers of E2-supplemented mice with metastasis to different organs after injection with non-luciferase-tagged MCF7 controls versus MCF7HSD (non-luciferase, top) and with luciferase-expressing MCF7L2T controls versus MCF7L2T-HSD (luciferase+, bottom).
(E) E1 and E2 concentrations (pg/mL) in MCF7L2T control, C, or MCF7L2T-HSD (HSD), (n = 3).
(F) MCF7L2T, C, or MCF7L2T-HSD (HSD) were orthotopically injected into E2-supplemented NOD-SCID mice. See representative BLI at 6 weeks (left) and mean tumor volumes/time (right) (n = 3).
(G) Representative H&E-stained lung sections.
(H) Primary tumors were removed at 1,000 mm3, and mice followed for metastasis. Representative BLI from mice orthotopically injected with MCF7L2T Cs or MF7L2T-HSD (HSD) showing lung metastasis. Mean ± SEM normalized photon flux/second from tumor metastases is graphed. p from ANOVA, **p < 0.001.
(I and J) Mean ± SEM lung weights (I) and lung metastatic nodules (J) in mice injected orthotopically with control or HSD17B14-overexpressing MCF7 cells. p from ANOVA, *p < 0.05, **p < 0.001, and ***p < 0.0001, see also Figure S4. All graphs show mean (±SEM) from at least 3 biological repeat and >triplicate replicate assays; p from Student’s t test and ANOVA, *p < 0.05, **p < 0.001, and ***p < 0.0001. Scale bars indicate microns.
