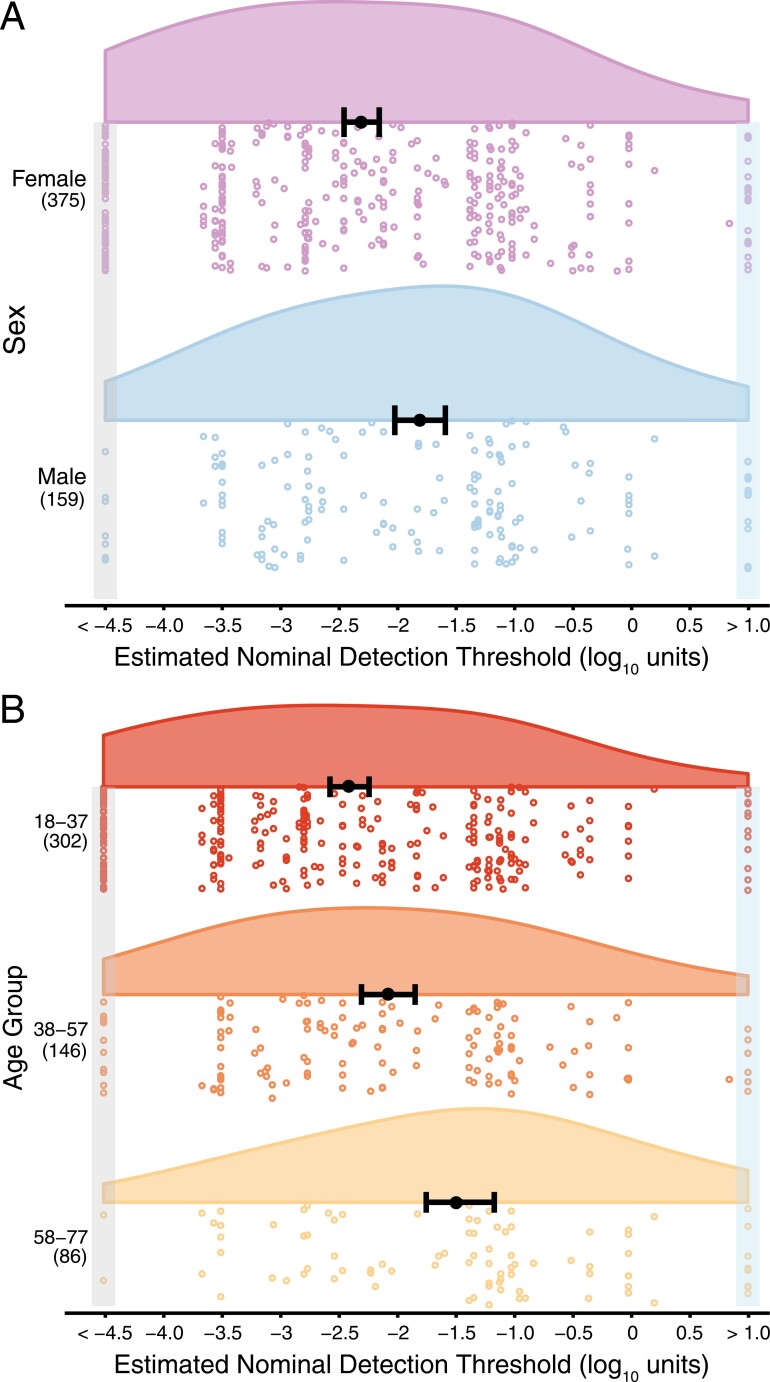
Fig. 4.
Smell thresholds using the ArOMa-T. (A) Raincloud plots showing odor detection thresholds stratified by sex. Open circles represent odor detection thresholds for individual participants; women are shown in purple and men in blue. (B) Raincloud plots showing odor detection thresholds stratified by age group, with each age group represented by a different color; again, open circles indicate odor detection thresholds for individual participants. In both panels, the solid black dot is the point estimate of the mean and error bars are 95% confidence intervals of that estimate. Group sample sizes are shown in parentheses on the left side of the plot. Thresholds shown in the boxes on the left and right sides were imputed in accordance with the ASTM E679 rules for extreme values outside the range of the concentrations tested; the light blue box on the right highlights functionally anosmic individuals with thresholds above the range tested here, while the gray box on the left indicates highly sensitive normosmic individuals who responded YES to all odorant concentrations. The detection threshold (x-axis) is expressed in the base-10 logarithm of the nominal concentrations. For color figure refer to online version.

