Fig. 1.
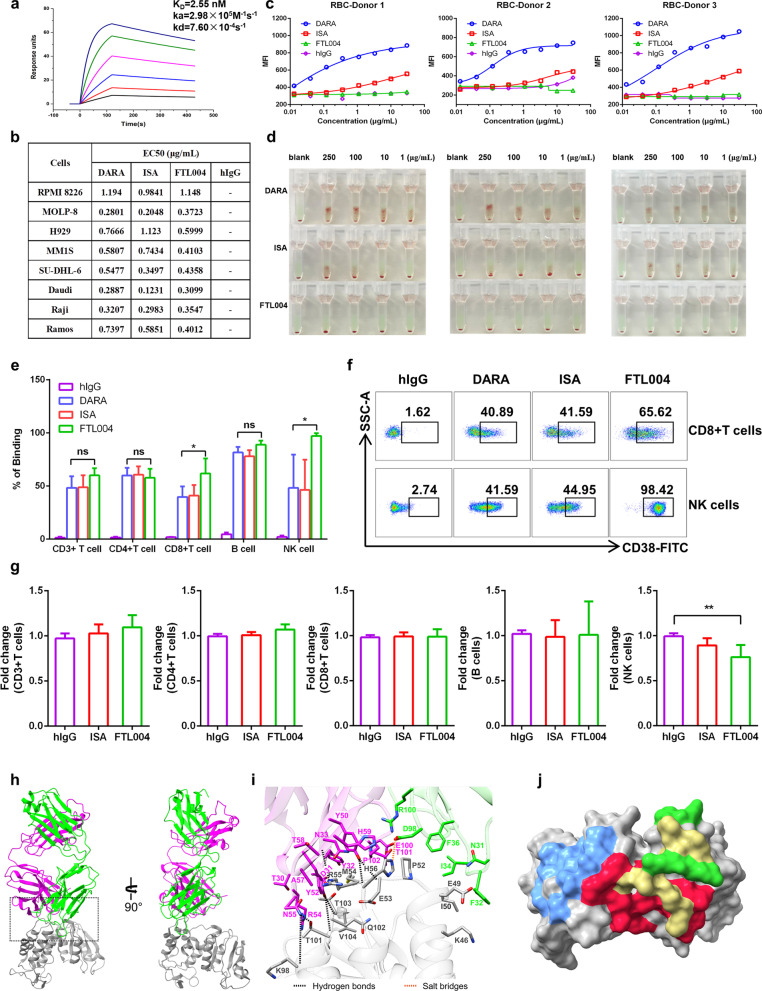
Distinct binding profile of FTL004 to CD38+ tumor cells, RBCs, and immune cells. a Affinity analysis of FTL004 to human CD38 as measured by Biacore 8 K (KD = 2.55 × 10⁻⁹ mol/L). b EC50 values for anti-CD38 mAbs binding to diverse cells. DARA, daratumumab; ISA, isatuximab. c Binding of FTL004, daratumumab or isatuximab to freshly isolated RBCs from healthy donors. d Indirect antiglobulin tests for CD38 mAbs to the same three healthy donors RBCs above. e The percentage of binding of CD38 mAbs to normal PBMCs (n = 4), including to CD45+ CD3+ T cells, CD3+ CD4+ T cells, CD3+ CD8+ T cells, CD45+ CD19+ B cells and CD3-CD56+ NK cells. Data show means ± SD and unpaired Student’s t tests were used to determine the statistical significance between daratumumab versus FTL004. *P < 0.05, **P < 0.01 and ***P < 0.001. f Flow cytometry dot plots showing the binding of anti-CD38 mAbs to NK cells and CD8+ T cells. g PBMCs from normal donors (n = 6) were pretreated with 1 μg/mL FTL004 or isatuximab for 3 days. Flow cytometry was used to determine the percentage of CD3+ T cells, CD4+ T cells, CD8+ T cells, B cells, and NK cells in lymphocytes. Data were then normalized to isotype controls and fold changes (means ± SD) are shown. Isotype cells were used as controls in settings. h The overall structure of the CD38/FTL004 Fab complex. CD38 and the heavy and light chains of FTL004 are colored gray, purple, and green, respectively. i Stereoscopic view of the direct hydrogen bonds, salt bridge, in the interface between CD38 and FTL004. j Comparison of the binding of FTL004, daratumumab, and isatuximab. Surface representation of the epitopes of FTL004 (green), daratumumab (blue), isatuximab (red) and superposition part of FTL004 and isatuximab (yellow) on CD38 (gray)

