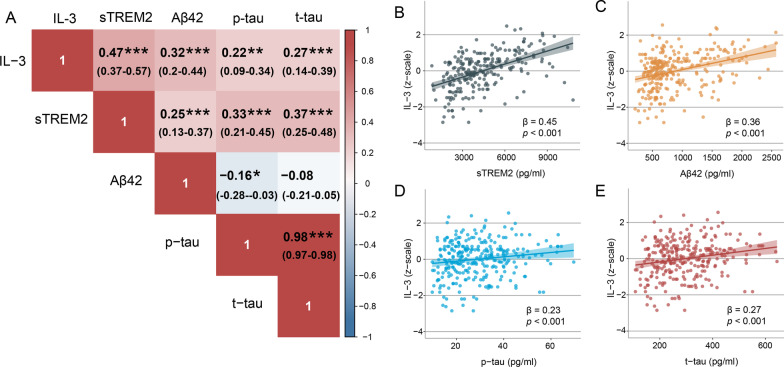
Fig. 2.
Biomarker correlations. A The left panel shows biomarkers correlations. Red indicates positive correlation, and blue indicates negative correlation. The Spearman partial correlation coefficients (r) and confidence interval are shown in each square after controlled age, sex, education, and APOE4 status. *P < 0.05, **P < 0.01 and ***P < 0.001. B–E Scatter plots show the associations of CSF IL-3 with CSF sTREM2, CSF Aβ42, CSF p-tau, and CSF t-tau. The normalized regression coefficients (β) and P values shown in scatter plots were derived from multiple linear regression. Linear model fits are indicated together with 95% confidence intervals. These models were adjusting age, sex, education, and APOE4 status

