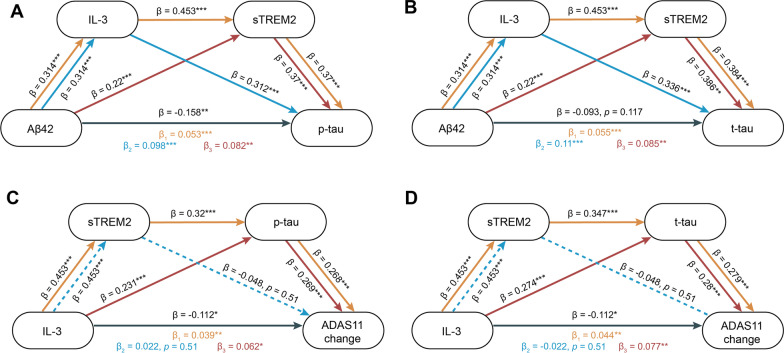
Fig. 4.
Mediation analysis. A, B Three mediation pathways were conducted between Aβ42 and p-tau/t-tau: (1) Aβ42 → IL-3 → sTREM2 → p-tau/t-tau; (2) Aβ42 → IL-3 → p-tau/t-tau; (3) Aβ42 → sTREM2 → p-tau/t-tau. C, D Three mediation pathways were assessed between IL-3 and ADAS11 annual change: (1) IL-3 → sTREM2 → p-tau/t-tau → ADAS11 change; (2) IL-3 → sTREM2 → ADAS11 change; (3) IL-3 → p-tau/t-tau → ADAS11 change. These three pathways are presented using yellow, blue, and red lines. All mediation paths are adjusted by covariates (age, sex, education, and APOE4 status). The β coefficients in each path and P-values for mediation effects were calculated by a bootstrap test with 10,000 resampling iterations. The dotted line indicates that the indirect effect is not significant (P ≥ 0.05), and the solid line indicates that the indirect effect is significant (P < 0.05). *P < 0.05, **P < 0.01 and ***P < 0.001

