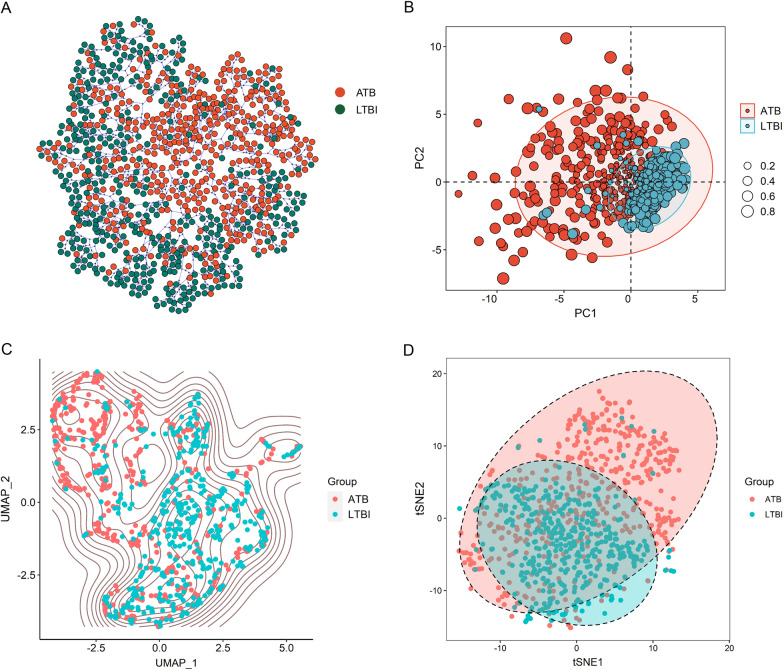
Fig. 2.
Clustering and dimension reduction analysis based on laboratory data of ATB patients and LTBI individuals. A Tree and leaf plots showing the clustering on the basis of laboratory data. B The plot showing PCA dimension reduction based on laboratory data. The size of the circle represents the cos2. C The plot showing UMAP dimension reduction based on laboratory data. D The plot showing tSNE dimension reduction based on laboratory data. ATB: active tuberculosis; LTBI: latent tuberculosis infection; PCA: principal components analysis; tSNE: t-distributed stochastic neighbor embedding; UMAP: uniform manifold approximation and projection

