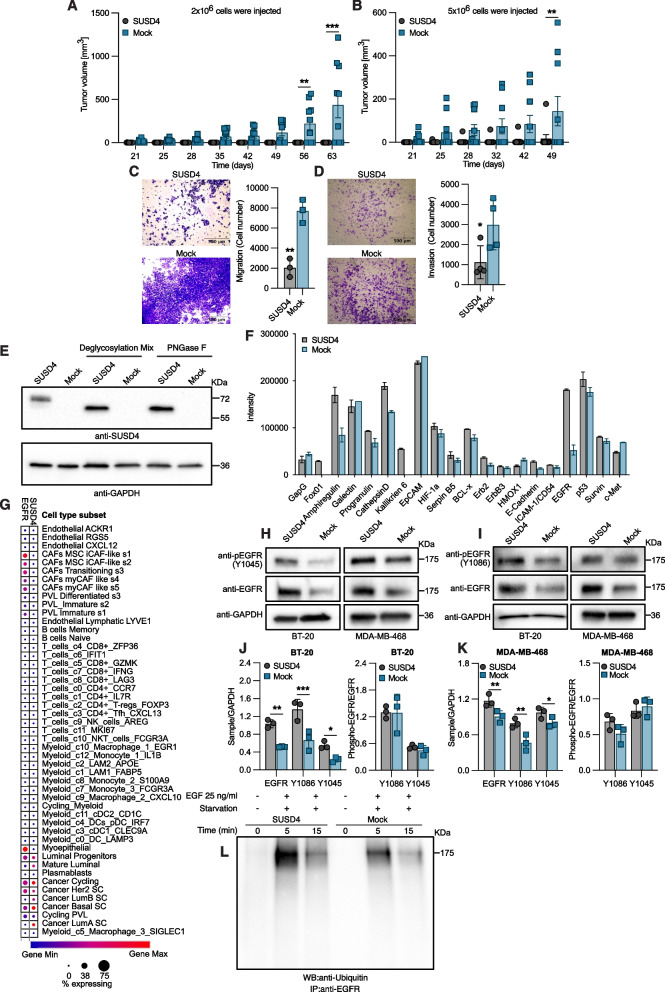
Fig. 1.
SUSD4 expression suppresses tumor growth and affect EGFR dynamics. Tumor growth monitored in a syngeneic mouse model. 4 T1-Luc2 cells stably expressing mouse SUSD4, or mock control cells were injected into the mammary fat pad of BALB/c mice (n = 10 mice per group). In first experiment (A) 2 × 10⁶ cells were injected per mouse and in the second (B) 5 × 10⁶ cells were injected per mouse (Error bars represents standard error of the mean). (C) Migration and invasion assay (D) of 5 × 10⁴ 4 T1-Luc2 cells incubated for 48 h under serum. (E) Immunodetection of SUSD4 from lysates of BT-20 cells stably expressing human SUSD4 or mock control cells treated with deglycosylation enzymes to assess SUSD4 N-glycosylation status. (F) Protein profile comparison between SUSD4-expressing BT-20 cells and mock control cells using the Human XL Oncology Array (n = 2 technical repeats). (G) Expression of SUSD4 and EGFR, independent of each other, in individual cell types present in breast cancer tumors. Representative immunoblots depicting total EGFR levels and phospho-EGFR at Tyr1045 (H) or Tyr1086 (I) in SUSD4-expressing BT-20 or MDA-MB-468 cells and corresponding mock control cells. Densitometric analysis of total EGFR and phospho-EGFR levels together with the ratio of phosphorylated EGFR to total EGFR in BT-20 cells (J) and MDA-MB-468 cells (K). (L) EGFR ubiquitination assessed by immunoprecipitation of EGFR in serum-starved EGF-treated BT-20 cell expressing SUSD4 or mock control cells followed by immunoblot detection of ubiquitin. All results were repeated in at least three independent biological experiments unless otherwise specified. The p-value was estimated with t test when two groups were compared and with Two-way ANOVA test when two or more groups were compared for two independent parameters *p ≤ 0.05, **p ≤ 0.01, ***p ≤ 0.001 and ****p ≤ 0.0001

