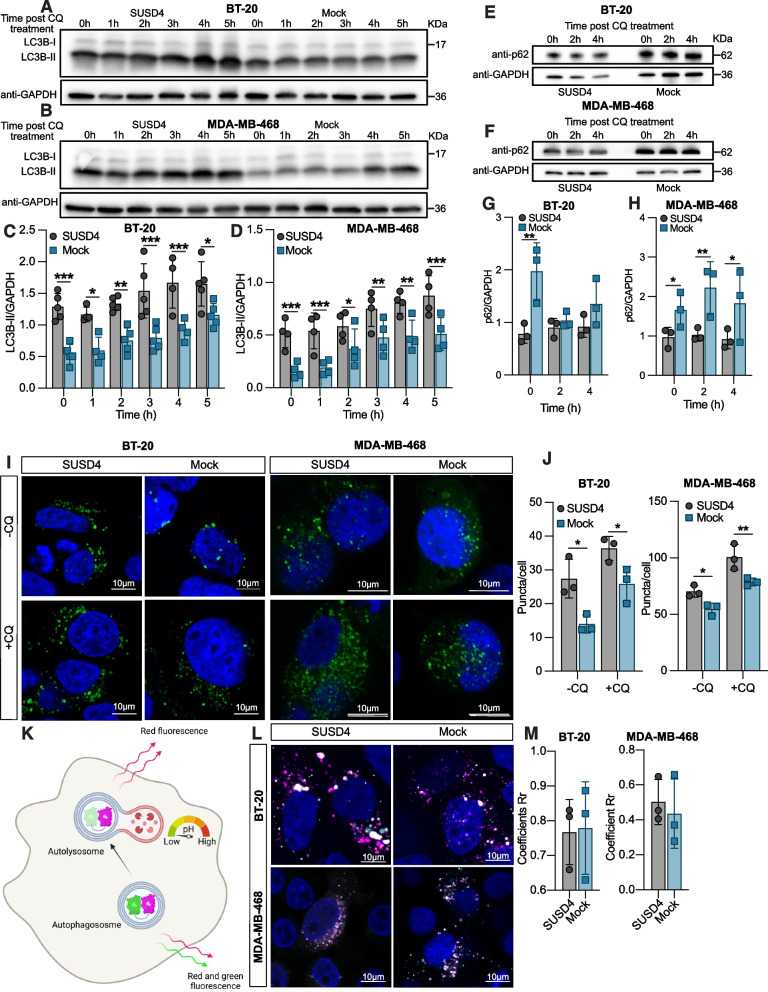
Fig. 2.
SUSD4 expression leads to increased autophagic flux. Autophagy levels SUSD4-expressing BT-20 cells (A and C) or MDA-MB-468 cells (B and D) and corresponding mock control cells treated with chloroquine for up to 5 hours. Representative immunoblots (A and B) and densitometric analysis (C and D) of LC3B-II levels in SUSD4-expressing cells and mock control cells for each cell line and chloroquine treatment time. Autophagy levels depicted by p62 levels in SUSD4-expressing BT-20 cells (E and G) or MDA-MB-468 cells (F and H) and corresponding mock control cells treated with chloroquine for 2- or 4 hours. Representative immunoblots and densitometric analysis of p62 levels in BT-20 cells (E and G) and MDA-MB-468 cells (F and H). LC3B puncta in SUSD4-expressing BT-20 cells or MDA-MB-468 cells and corresponding mock control cells expressing GPF-tagged LC3B visualized by confocal microscopy. Representative images showing LC3B puncta (green) and DAPI (blue) (I) as well as quantified number of puncta per cell (J) in untreated cells and cells treated with chloroquine for 3 hours (Every data point represents the average of puncta per cell from at least 10 cells per sample). Assessment of autophagosome-lysosome fusion in BT-20 cells or MDA-MB-468 cell expressing SUSD4 and corresponding mock control cells using the Premo Autophagy Tandem Sensor RFP-GFP-LC3B (K), created with BioRender.com. Representative images (L) and quantified colocalization coefficient (M) of magenta- and green-stained vesicles. (Every data point represents the average of at least 10 cells per sample). All results were repeated in at least three independent biological experiments. The p-value was estimated with t test when two groups were compared and with Two-way ANOVA test when two or more groups were compared for two independent parameters *p ≤ 0.05, **p ≤ 0.01, ***p ≤ 0.001 and ****p ≤ 0.0001

