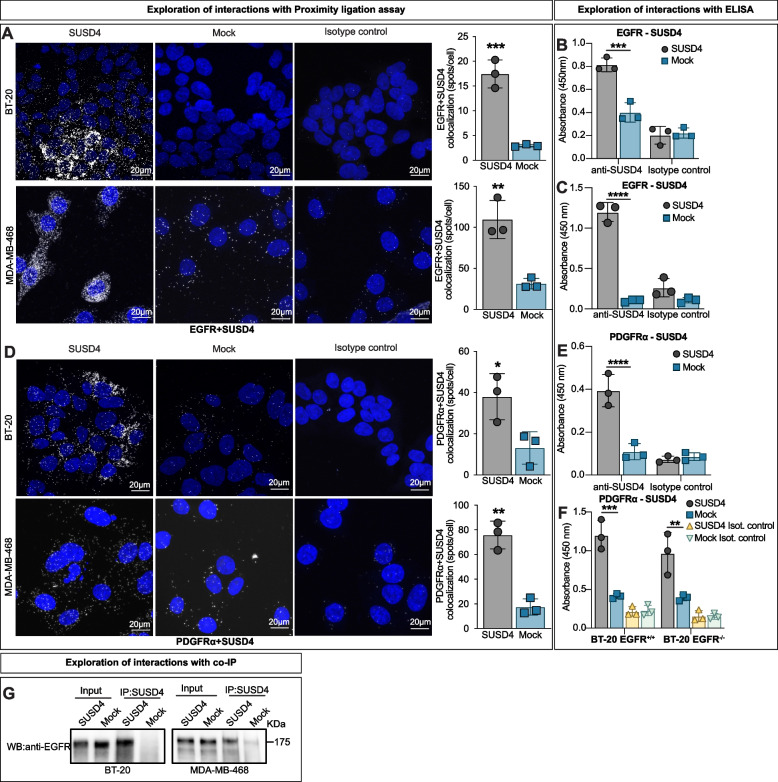
Fig. 3.
SUSD4 interacts with growth factor receptors. A Proximity ligation assay indicating interaction (white spots in maximum intensity projection of z-stack image) between SUSD4 and EGFR in both BT-20 and MDA-MB-468 cells stably expressing SUSD4 (every data point represents the average of at least 10 cells per sample). Sandwich ELISA using lysates of SUSD4-expressing BT-20 (B) or MDA-MB-468 cells (C) and corresponding mock control cells showing an interaction between SUSD4 and EGFR in both cell lines (n = 3 biological repeats in each). D Proximity ligation assay indicative of an interaction (white spots in maximum intensity projection of z-stack image) between SUSD4 and PDGFRα in BT-20 cells and MDA-MB-468 cells stably expressing SUSD4 (Every data point represents the average of at least 10 cells per sample). E Sandwich ELISA showing an interaction between SUSD4 and PDGFRα in BT-20 cells expressing SUSD4. F Same ELISA as in (E) but including lysates of CRISPR/Cas9-mediated EGFR knockout cells stably expressing human SUSD4 and corresponding mock control cells. G Co-immunoprecipitation of the protein complexes between EGFR and SUSD4 using lysates of the BT-20 and MDA-MB-468 cells stably expressing SUSD4. All results were repeated in at least three independent biological experiments. The p-value was estimated with t test when two groups were compared and with Two-way ANOVA test when two or more groups were compared for two independent parameters *p ≤ 0.05, **p ≤ 0.01, ***p ≤ 0.001 and ****p ≤ 0.0001

