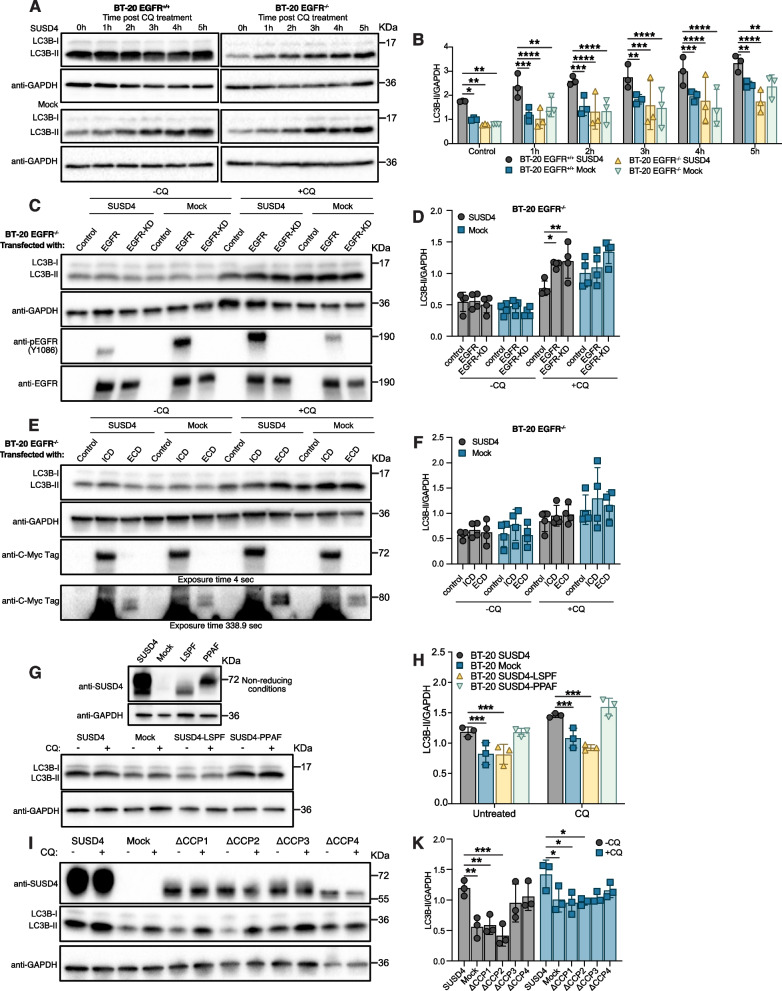
Fig. 4.
SUSD4’s effect on autophagy depends on its interaction with the EGFR. Autophagy in SUSD4-expressing BT-20 cells and mock control cells in addition to CRISPR/Cas9-mediated EGFR knockout BT-20 cells stably expressing SUSD4 and corresponding EGFR knockout mock control cells. Cells were treated with chloroquine for up to 5 hours and LC3B-II levels were assessed by immunoblot. Representative immunoblots (A) and densitometric analysis (B) of LC3B-II levels at each time-point. Total EGFR or a kinase-dead mutant EGFR was re-introduced in SUSD4-expressing BT-20 EGFR knockout cells and BT-20 EGFR knockout mock control cells. C Representative immunoblot verifying the presence of total-, or kinase-dead EGFR as well as showing LC3B-II levels in both untreated cells and cells treated with chloroquine for 4 hours. D Densitometric analysis of LC3B-II levels shown in (C) (n = 4 biological repeats). Representative immunoblots (E) and densitometric analysis (F) of LC3B-II levels in untreated and chloroquine treated (4 hours) mock control and SUSD4-expressing BT-20 EGFR knockout cells transiently transfected with constructs allowing for the expression of myc-tagged intra- or extracellular domain of EGFR (n = 4 biological repeats). The molecular weight of the EGFR ICD and ECD is 72 kDa and 80 kDa, respectively. G Autophagy in BT-20 cells expressing SUSD4 phosphorylation mutants SUSD4-LSPF (Y379F) or SUSD4-PPAF (Y414F). Immunoblot of SUSD4 phosphorylation mutants in addition to a representative immunoblot showing LC3B-II levels in untreated cells and cells treated with chloroquine for 3 hours. H Densitometric analysis of LC3B-II levels in BT-20 SUSD4 phosphorylation mutants shown in (G). Deletion mutants of extracellular CCP domains of SUSD4 stably expressed in BT-20 cells. Autophagy was evaluated with LC3B western blots (I) in the presence or absence of chloroquine and band density relative to GAPDH was plotted (K). All results were repeated in at least three independent biological experiments. The p-value was estimated with t test when two groups were compared and with Two-way ANOVA test when two or more groups were compared for two independent parameters *p ≤ 0.05, **p ≤ 0.01, ***p ≤ 0.001 and ****p ≤ 0.0001

