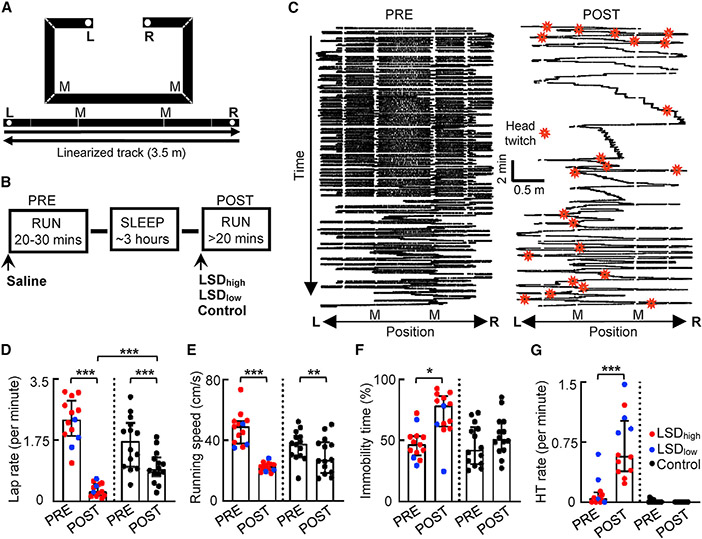
Figure 1. LSD enhanced head twitching and immobility.
(A) C-shaped track (top) and the linearized trajectories (bottom). L and R, reward locations; M, landmark locations (two corners of the long arm).
(B) Behavioral procedure is as follows: two track-running sessions (PRE and POST), with each following a drug administration, separated by a sleep session. Prior to PRE, saline was injected. Prior to POST, either LSDhigh, LSDlow, or a control (Ctrl) condition (injection of the 5HT2AR antagonist M100907 followed by injection of LSDlow, M100907 alone, or saline alone) was administered.
(C) Linearized spatial trajectories (black lines) and head twitches (HTs; red stars) of an example rat under LSDhigh in PRE and POST. White gaps, linearization artifacts when the animal made sharp turns at corners. M, two of the corners.
(D–G) Lap rate (D), running speed (E), percentage of immobile time (F), and HT rate (G) in PRE and POST under LSDhigh (n = 10), LSDlow (n = 3, except for G, which is n = 4), and the Ctrl (n = 14) conditions. Each dot is a session. Boxplot: median and [25% 75%] range values; same in other figures. *p < 0.05, **p < 0.01, ***p < 0.001.

