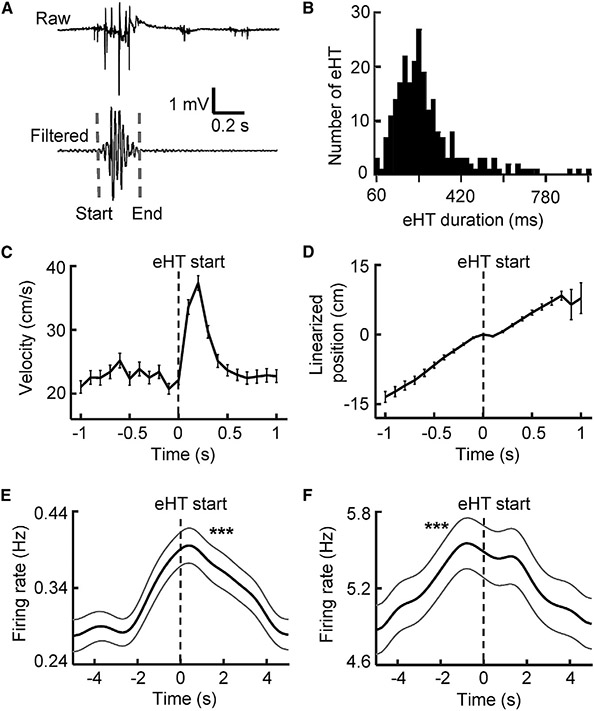
Figure 2. Increased firing rates of CA1 and VC cells around head twitching.
(A) An example HT event identified by EMG (eHT). Raw, raw EMG trace; filtered, the same EMG trace filtered within 20–60 Hz; dashed line, eHT start/end time.
(B) Distribution of eHT duration (n = 245 eHTs).
(C) Average velocity (mean ± SE) of head movement triggered by eHT start times (time 0).
(D) Average linearized position (mean ± SE) along the moving trajectory relative to the eHT start times. The linearized positions at eHT start times were aligned to position 0.
(E and F) Average firing rate (mean ± SE) of active CA1 (E) and VC (F) cells triggered by the eHT start times (n = 218 eHTs). ***p < 0.001 for peak value. See also Figure S1.

