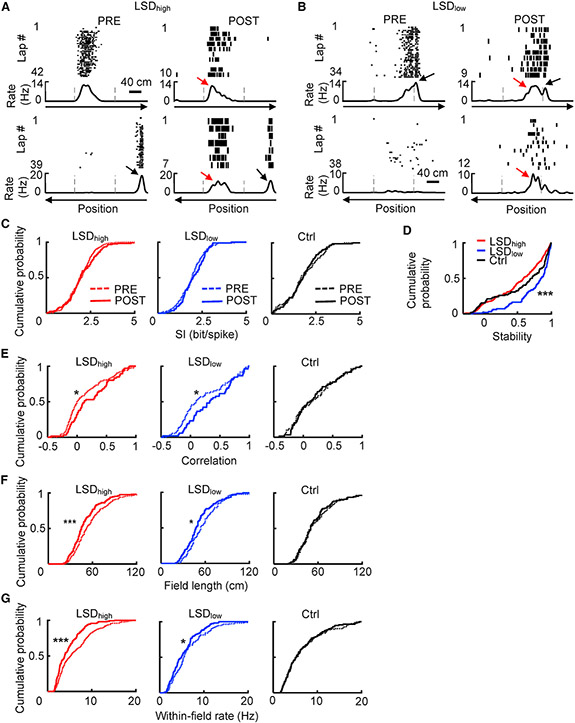
Figure 3. CA1 place cells under LSD maintained similar firing locations but had reduced directionality and within-field firing rates.
(A and B) Example place cells under LSDhigh (A) and under LSDlow (B). Each panel shows the lap-by-lap spike raster (top) of a cell and its rate curves (bottom) during running on the two opposite, linearized trajectories of the C-track in PRE and POST. Dashed lines, landmark positions on the track; black arrows, dominant place field in PRE had similar firing locations with reduced rates in POST; red arrows, place field became more bi-directional in POST.
(C) Cumulative distributions of spatial information (SI) under LSDhigh (PRE: n = 244 cell × trajectories, POST: n = 121), LSDlow (PRE: n = 101, POST: n = 83), and the Ctrl conditions (PRE: n = 85, POST: n = 84) for place cells on active trajectories in PRE and POST.
(D) Cumulative distributions of stability under LSDhigh (n = 204 cell × trajectories), LSDlow (n = 98), and the Ctrl (n = 104) condition.
(E) Cumulative distributions of correlation between rate curves of two opposite trajectories, as a measure of directionality under LSDhigh (PRE: n = 175 cells, POST: n = 66), LSDlow (PRE: n = 72, POST: n = 52), and the Ctrl conditions (PRE: n = 58, POST: n = 55).
(F and G) Same as (E), but for field length (F) and within-field firing rate (G) under LSDhigh (PRE: n = 286 fields, POST: n = 167), LSDlow (PRE: n = 117, POST: n = 112), and the Ctrl (PRE: n = 114, POST: n = 113) conditions. *p < 0.05, ***p < 0.001.
See also Figures S1-S4.

