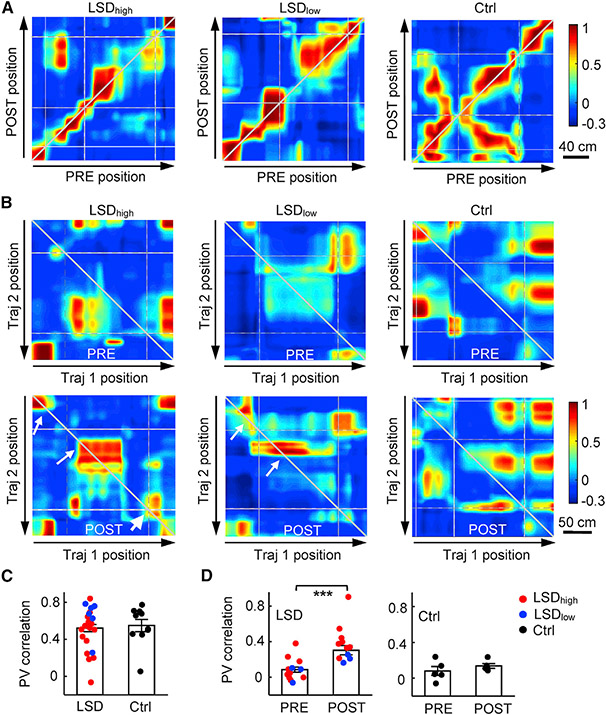
Figure 4. Stable representation but reduced directionality in active place cell ensembles.
(A) Example PV correlations of CA1 place cells between PRE and POST along the same linearized trajectory (cross-session PVcorr) under the LSDhigh, LSDlow, or the Ctrl condition. Arrows, running directions; gray broken lines, landmark locations; white lines, linearization artifacts when animals made sharp turns around some corners of the track. Note the similar values (colors) along the diagonal line under different conditions.
(B) Same as (A), but for example PV correlations between two opposite trajectories (Traj 1 and Traj 2) in the same PRE or POST session (cross-trajectory PVcorr). Note that values along the reverse diagonal line were higher in POST (arrows) than those in PRE under LSDhigh and LSDlow.
(C) Average (mean ± SEM) cross-session PVcorr for all recording days and all animals under LSD (LSDhigh and LSDlow combined, n = 22 trajectories) and the Ctrl condition (n = 10). Each dot is a trajectory.
(D) Same as in (C), but for average cross-trajectory PVcorr in PRE and POST for LSD (PRE: n = 17 sessions, POST: n = 16) and Ctrl (PRE: n = 5, POST: n = 5). Each dot is a session. ***p < 0.001.

