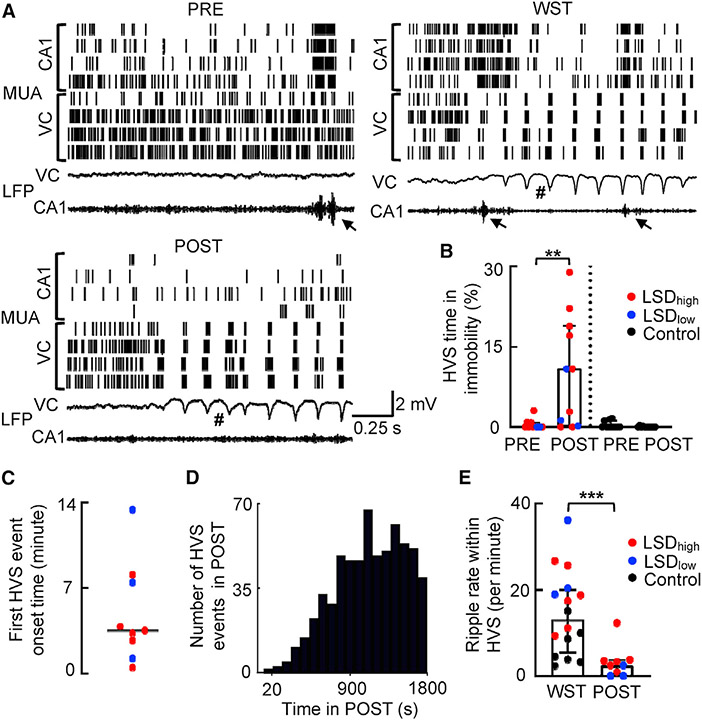
Figure 6. LSD promoted high-voltage spike (HVS) events during immobility.
(A) CA1 and VC MUAs (top) and LFPs (bottom) in PRE, in WST, and in POST during immobility under LSDhigh in an example rat. Each row in MUAs includes all spikes recorded from a tetrode. Each tick is a spike. VC LFPs were in broad band (0.5 Hz–2 kHz) and CA1 LFPs in ripple band (100–250 Hz). Arrow, ripple event; #, HVS event.
(B) Percentage of time in HVSs among total immobility time in PRE and POST under LSD (n = 11 sessions) and the Ctrl (n = 11) condition. Each dot is a session. Box and bars, median and [25% 75%] range values.
(C) Onset times of the first HVS event in POST for each of the 9 rats (out of 11 rats; 2 had no HVSs within the first 30 min of POST). Line, median value.
(D) Distribution of HVS peak times in POST under LSD (n = 622 HVS events from 9 rats).
(E) Same as (B), but for occurrence rate of ripples per minute within HVS events in WST (n = 16 sessions) and in POST (N = 9) during immobility under LSD. *p < 0.05; **p < 0.01; ***p < 0.001.
See also Figure S6.

