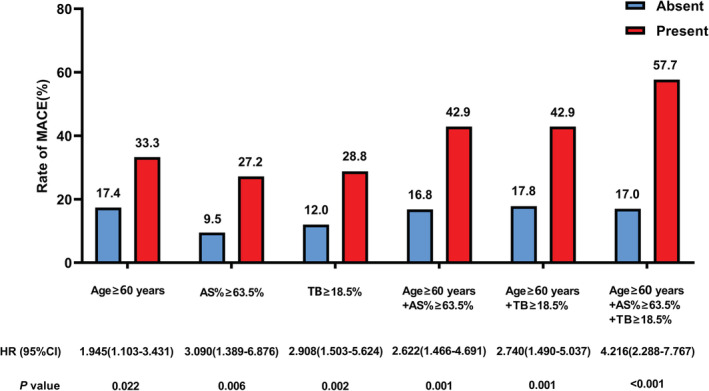
Figure 3. Rate of MACE.

Specific OCT parameters alone or in combination and rate of MACE are shown. The best cutoff values of age ≥60 years, AS% ≥63.5%, and TB≥18.5% from the ROC curve analysis were used for further MACE cumulative rate Kaplan‐Meier estimate analyses.
AS% indicates percentage of area stenosis; HR, hazard ratio; MACE, major adverse cardiac events; OCT, optical coherence tomography; ROC, receiver operating characteristic; and TB, thrombus burden.
