
Figure 1. scRNA‐seq identifying CD45+ immune cells under homeostatic and infarcted conditions.
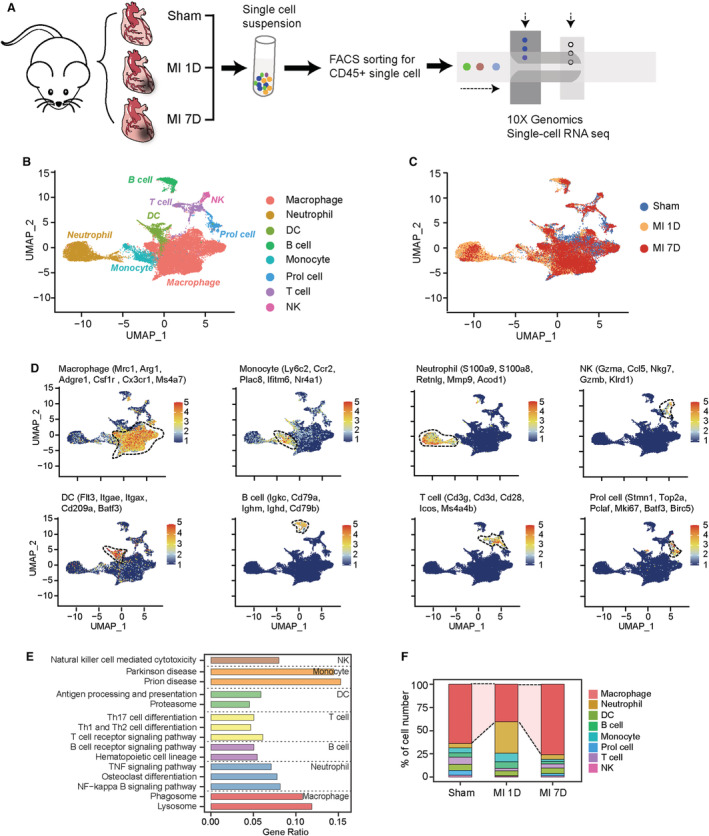
A, Schematic diagram of scRNA‐seq analysis to detect cardiac immune cells at 7 days post sham surgery, MI‐1D, and MI‐7D. B, UMAP plot showing included immune cells at 7 days post sham surgery, MI‐1D, MI‐7D. Cell lineages are denoted according to the expression of marker genes and colored accordingly. C, UMAP plot represented cells from sham, MI‐1D, and MI‐7D samples. D, Feature plots showing scaled expression of marker genes for macrophages, monocytes, neutrophils, NK, DCs, B and T cells, and proliferation‐like cells (Prol cell). E, Kyoto Encyclopedia of Genes and Genomes pathway analysis (KEGG) based on differentially expressed marker genes determined the biological function of different cell lineages. F, Proportion of immune cells at 7 days post sham surgery, MI‐1D, and MI‐7D. DC indicates dendritic cells; FACS, fluorescence‐activated cell sorting; MI, myocardial infarction; MI‐1D, 1 day after MI surgery; MI‐7D, 7 days after MI surgery; NF, nuclear factor; NK, natural killer; scRNA‐seq, single‐cell RNA sequencing; and UMAP, uniform manifold approximation and projection.