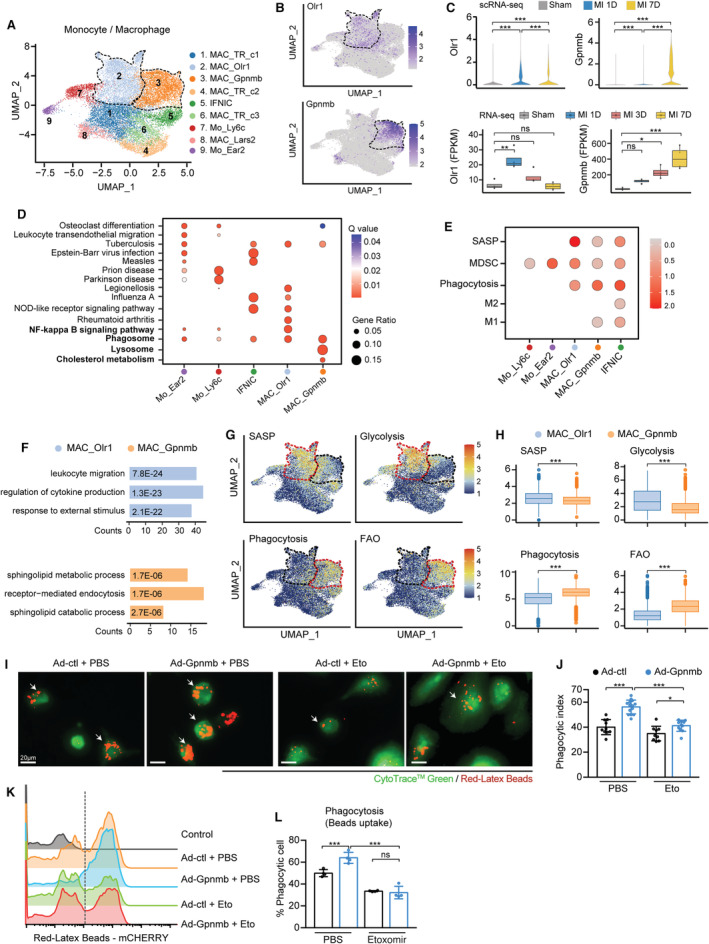
Figure 2. Two ischemia‐associated macrophage subpopulations contributed to inflammation and phagocytosis.

A, UMAP plot showing 9 monocyte/macrophage subpopulations at 7 days post sham surgery, MI‐1D, and MI‐7D. B, MAC_Olr1 and MAC_Gpnmb is distinguished by the differential expression of Olr1 and Gpnmb, as visualized by the feature plot. C, Top: Violin plots showing the scaled expression of macrophage Olr1 and Gpnmb in scRNA‐seq (n=6554, 5361, 7468 in sham, MI‐1D, and MI‐7D, respectively; Kruskal–Wallis followed by Dunn test). Bottom: Determining the transcriptional expression of macrophage Olr1 and Gpnmb in public RNA‐seq data sets after MI (n=4 for each group; 1‐way ANOVA followed by Bonferroni test). D, Gene ontology (GO) analysis with differentially expressed marker genes of monocytes (Mo_Ear2, Mo_Ly6c) and macrophages (IFNIC, MAC_Olr1, MAC_Gpnmb). E, Dot plot exhibiting scores of SASP, MDSC, phagocytosis, M2 and M1 macrophages in monocyte and macrophage subsets. F, GO pathway analysis of differentially upregulated genes in MAC_Olr1 and MAC_Gpnmb subsets. G, UMAP plots showing the scaled level of SASP, glycolysis, phagocytosis, and FAO in monocyte/macrophage subsets. H, Quantitative results of SASP, glycolysis, phagocytosis, and FAO in MAC_Olr1 and MAC_Gpnmb subclusters (n=5004, 3855 in MAC_Olr1 and MAC_Gpnmb; Mann–Whitney test). I, BMDMs with or without Gpnmb overexpression treated with etomoxir or PBS and subjected to fluorometric phagocytosis assay. Scale bar: 20 μm. J, Phagocytotic index referring to panel I, quantified by the ratio of macrophages with fluorometric red‐Latex beads among all CytoTrace Green‐positive cells (n=10, 14, 9, 11, respectively, 2‐way ANOVA followed by least significant difference test). K, Ability of macrophage phagocytosis, as determined by flow cytometry analysis. L, Quantification of panel K (n=4 for each group; 2‐way ANOVA followed by least significant differencetest). Ad indicates adenovirus; BMDM, bone marrow‐derived macrophage; FAO, fatty acid oxidation; IFNIC, macrophages with a type I interferon signature; MAC_Gpnmb, macrophage with differentially expressed Gpnmb; MAC_Olr1, macrophage enriched for Olr1; MDSC, myeloid‐derived suppressor cell; NF, nuclear factor; NOD, nucleotide‐binding and oligomerization domain; SASP, senescence‐associated secretory phenotype; scRNA‐seq, single‐cell RNA sequencing; and UMAP, uniform manifold approximation and projection.
