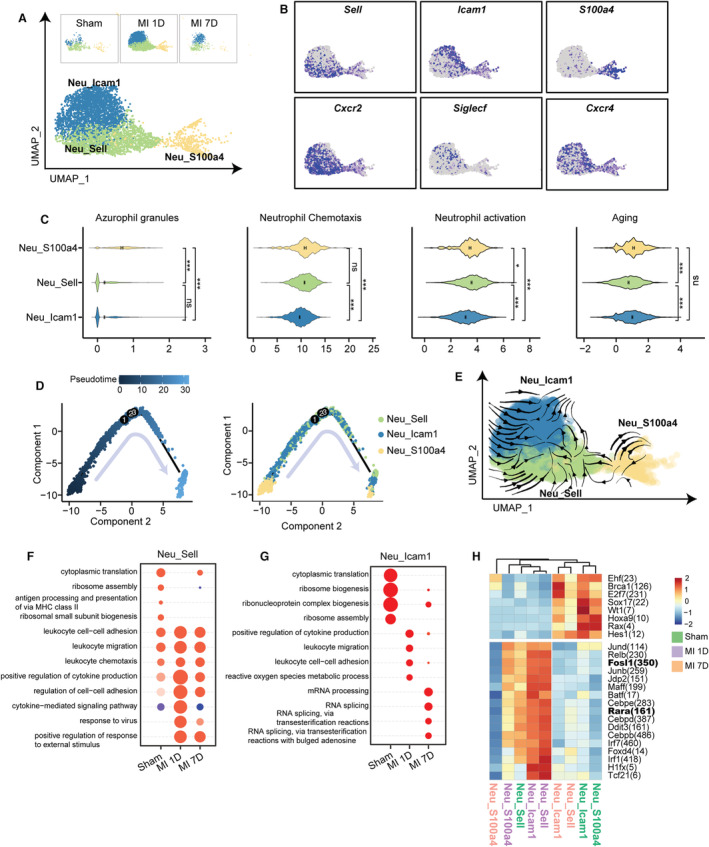
Figure 4. Three neutrophil subsets with differential ontogeny from mature, activation, to aging.

A, UMAP plot of 3 neutrophil subpopulations from sham, MI‐1D, and MI‐7D samples. B, Scaled expression of neutrophil marker genes. C, Scores of azurophil granules, neutrophil chemotaxis, activation, and aging in 3 neutrophil clusters (n=473, 1689, 2460 in Neu_S100a4, Neu_Sell, Neu_Icam1, respectively; 1‐way ANOVA followed by Bonferroni test). D, Analyzing developmental trajectories of 3 neutrophil clusters with monocle method, cells are reordered and colored by pseudotime or by cell type. E, RNA velocity analysis including all neutrophils were visualized as streamlines to determine potential differentiation directions. F, Selected top GO terms of Neu_Sell at 7 days post sham surgery, MI‐1D, and MI‐7D by comparing uniquely upregulated genes at 1 time point with those of the others. G, The enriched GO categories of Neu_Icam1 at sham, MI‐1D, and MI‐7D. H, The activities of transcriptional regulons among 3 neutrophil subsets at sham, MI‐1D, and MI‐7D. GO indicates gene ontology; MHC II, major histocompatibility complex II; and UMAP, uniform manifold approximation and projection.
