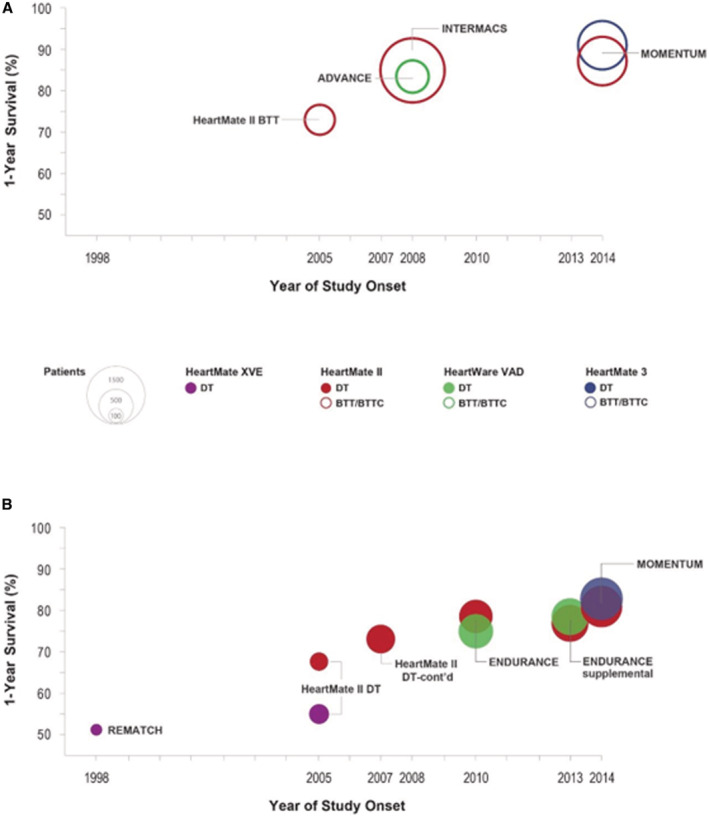
Figure 1. Trends in the rate of 1‐year survival across clinical study groups over time.

A and B, Display the 1‐year survival rates for patients enrolled in large studies of left ventricular assist devices. A, Patients implanted as bridge‐to‐transplant or bridge‐to‐transplant‐candidacy (both represented as open circles). B, Patients implanted as destination therapy (solid circles). Data are shown according to the respective start dates of each study. Each circle is color coded for each type of implanted device with purple for HeartMate XVE, maroon for HeartMate II, green for HeartWare, and blue for HeartMate 3. The study is labeled on the figure and data are listed in Table S1. The area of each circle represents the sample size in each group (reference sizes are shown in the key). BTC indicates bridge to candidacy; BTT, bridge to transplant; BTTC, bridge to transplant candidacy; DT, destination therapy; and VAD, ventricular assist device.
