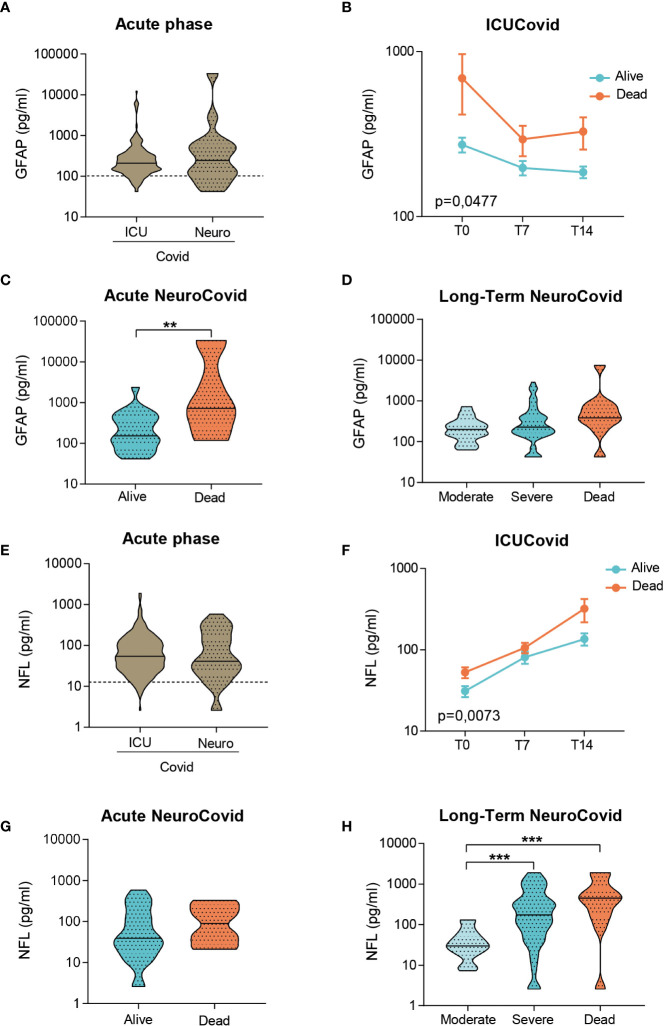
Figure 4.
Analysis of GFAP and NFL in plasma of two cohorts of COVID-19 patients. (A-H) GFAP (A-D) and NFL (E-H) concentrations were measured by Simoa technology in plasma samples from two cohorts of COVID-19 patients. (A, E) Violin plots represent the median, variability and probability density of GFAP (A) and NFL (E) at acute phase, in ICUCovid (n=79) and NeuroCovid samples (n=31). Dotted line indicates the mean level of healthy controls. (A) Mann Whitney, p = 0.7910; (E) Mann Whitney, p = 0.7054. (B, F) The concentrations of GFAP (B) and NFL (F) were measured in ICUCovid patients over time, at ICU admission (T0) and after 7 (T7) and 14 days (T14). ICUCovid patients were stratified as alive (n=32) and dead (n=14). Data (mean ± SEM) indicate biomarker concentrations. (B) Two-way ANOVA for repeated measures, p = 0.0477; **p < 0.005 alive versus dead at T0 by Sidak’s post hoc test; (F) Two-way ANOVA for repeated measures, p = 0.0073; ***p < 0.001 alive versus dead at T14 by Sidak’s post hoc test. (C, G) The concentrations of GFAP (C) and NFL (G) were measured at acute phase, in samples from NeuroCovid patients, stratified as alive (n=23) and dead (n=8). Violin plots indicate median, variability and probability density of biomarker concentrations. (C) Mann Whitney, **p = 0.0088; (G) Mann Whitney, p = 0.2868. (D, H) The concentrations of GFAP (D) and NFL (H) in long-term samples from NeuroCovid patients, stratified as moderate (n=18), severe (n=42) and dead (n=8). Violin plots indicate median, variability and probability density of biomarker concentrations. (D) Kruskal-Wallis, p = 0.0570; (H) Kruskal-Wallis, p < 0.0001. ***p < 0.001 by Dunn’s post hoc test.

