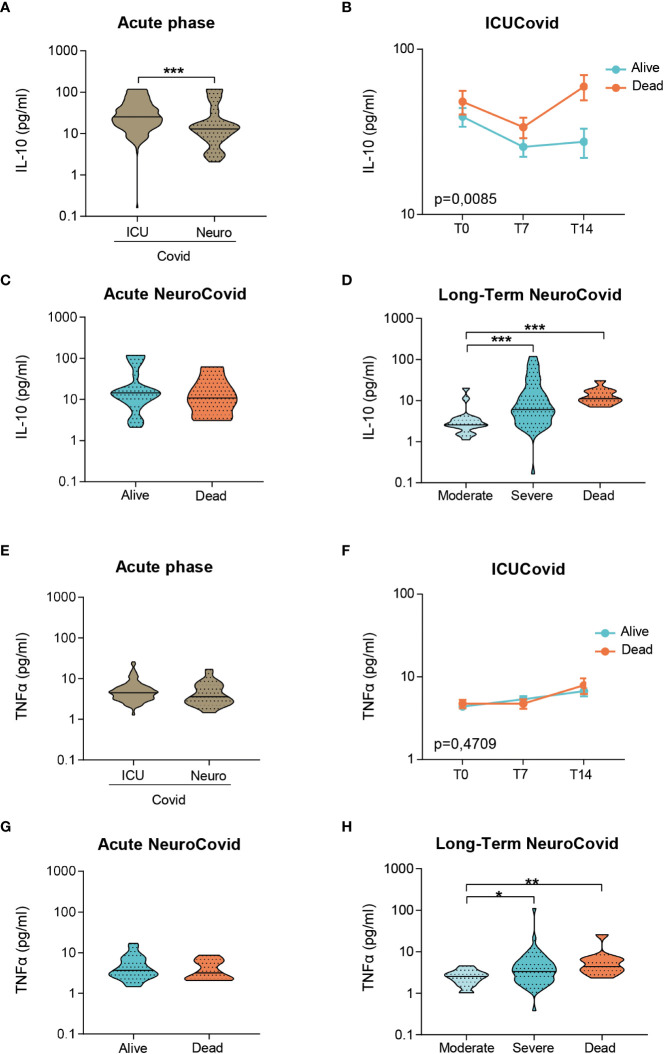
Figure 5.
IL-10 and TNFα in plasma of two cohorts of COVID-19 patients. (A-H) IL-10 (A-D) and TNFα (E-H) concentrations were measured by Simoa technology in plasma from two cohorts of COVID-19 patients. (A, E) Violin plots of IL-10 (A) and TNFα (E) in the acute phase, in ICUCovid (n=79) and NeuroCovid samples (n=31). (A) Mann Whitney, ***p < 0.001. (E) Mann Whitney, p = 0.085. (B, F) IL-10 (B) and TNFα (F) were measured in ICUCovid patients at ICU admission (T0) and after 7 (T7) and 14 days (T14). ICUCovid patients were stratified as alive (n=32) or dead (n=14). Data (mean ± SEM) indicate biomarker concentrations. (B) Two-way ANOVA for repeated measures, p < 0.01 for cohort factor; **p < 0.005 alive versus dead at T14 by Sidak’s post hoc test. (F) Two-way ANOVA for repeated measures, p = 0.4709. (C, G) IL-10 (C) and TNFα (G) were measured in the acute phase in samples from NeuroCovid patients, stratified as alive (n=23) or dead (n=8). (C) Mann Whitney, p = 0.6652; (G) Mann Whitney, p = 0.5498. (D, H) The concentrations of IL-10 (D) and TNFα (H) at a longer time, in samples from NeuroCovid patients, stratified as moderate (n=18), severe (n=42) or dead (n=8). (D) Kruskal-Wallis, p < 0.0001; ***p < 0.001 by Kruskal-Wallis, Dunn’s post hoc test. (H) Kruskal-Wallis, p < 0.01; *p < 0.05, **p < 0.01 by Kruskal-Wallis, Dunn’s post hoc test.

