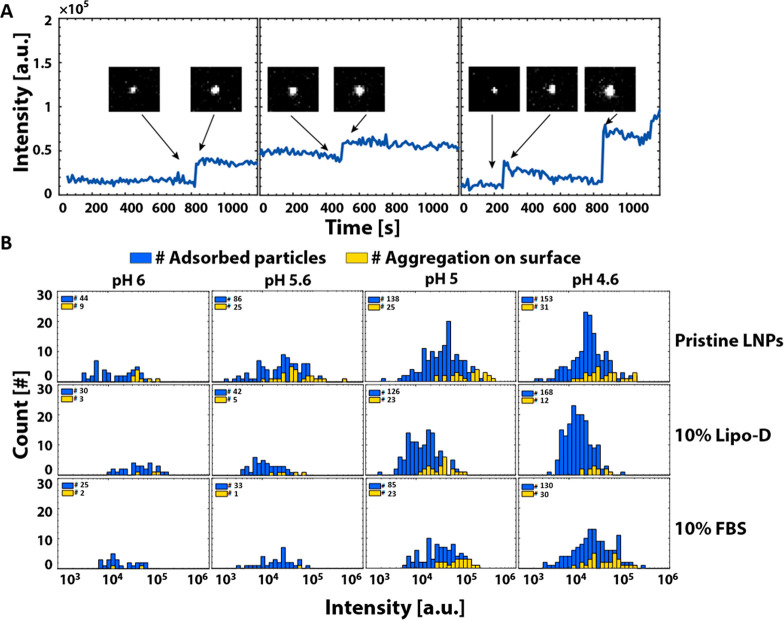
Figure 4.
(A) Intensity profiles of three representative LNPs displaying sudden intensity increase after binding to the ncSLB (the insets show the corresponding TIRF micrographs (8.0 × 7.0 μm2) prior to and after the intensity increase. (B) Intensity histograms for all LNPs (blue) adsorbed to the ncSLB for pristine LNPs in comparison with LNPs preincubated in 10% Lipo-D and 10% FBS measured at the end of each experiment (∼1100 s). The yellow bars represent the fraction of LNPs that displayed one or more sudden intensity increases.

