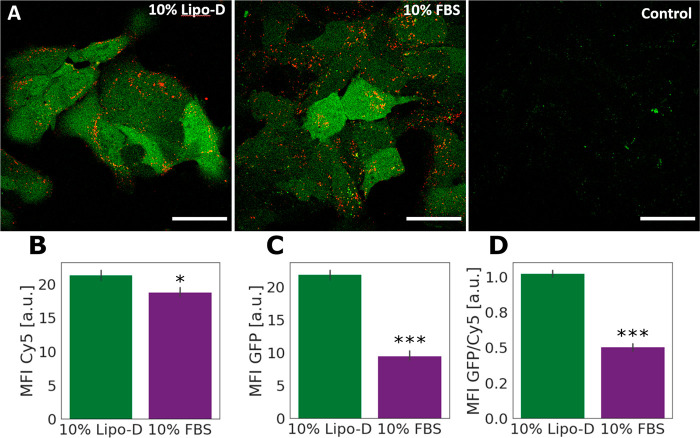
Figure 5.
LNP uptake and eGFP expression in Huh7 cells exposed to LNPs freshly diluted in 10% Lipo-D or 10% FBS. (A) Representative confocal microscopy images of cells treated as mentioned above, including negative control (LNP-untreated cells). The images were acquired and treated with identical settings, and intensities are thus comparable. All scale bars are 50 μm. (B–D) Cell uptake (Cy5 signal, B), protein expression (eGFP signal, C), and endosomal escape efficiency (Cy5/eGFP signal, D), measured by flow cytometry (N = 3; error bars represent standard deviation of three independent biological replicates). The cells were incubated with LNPs at a mRNA concentration of 0.625 μg/mL for 2 h prior to analysis to allow for detectable levels of uptake and protein expression. Means comparison for data in B–D was performed by an unpaired Student’s t test, N = 3; * and *** denote statistically significant differences in mean at the p < 0.05 and p < 0.0001 levels, respectively. The p value for means comparison for the data in (B) was 0.037.

