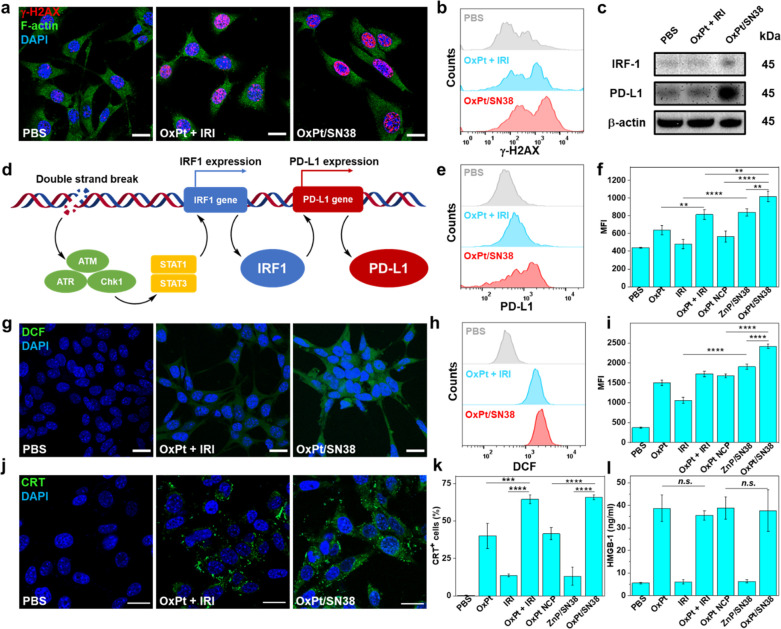
Figure 3.
OxPt/SN38 induces ICD and upregulates PD-L1. CLSM images (a) and flow cytometry (b) showing DNA DSBs of MC38 cells after treatment with OxPt plus IRI or OxPt/SN38. Scale bar: 20 μm. Cellular morphology was visualized by F-actin (green) staining. (c) Western blot of γ-H2AX, IRF1, and PD-L1 of MC38 cells. (d) Schematic showing PD-L1 upregulation induced by DNA DSBs. DSBs activate STAT signaling through ATM/ATR/Chk1 kinases, which in turn induces IRF1 activation and downstream PD-L1 upregulation. Flow cytometry (e) with statistical analysis (f) of PD-L1 expression in MC38 cells, n = 3. CLSM images (g) and flow cytometry (h) with statistical analysis (i) of ROS generation in MC38 cells, n = 3. CLSM images (j) and flow cytometry with statistical analysis (k) of CRT expression in MC38 cells, n = 3. (l) HMGB-1 release from MC38 cells detected by ELISA, n = 3. In all treatments, MC38 cells were incubated with drugs at 5 μM OxPt equiv and 9 μM SN38 equiv for 24 h. Data are expressed as means ± SD, **p < 0.01, ***p < 0.001, and ****p < 0.0001, by one-way ANOVA with Tukey’s multiple comparisons test. MFI denotes mean fluorescent intensity.

