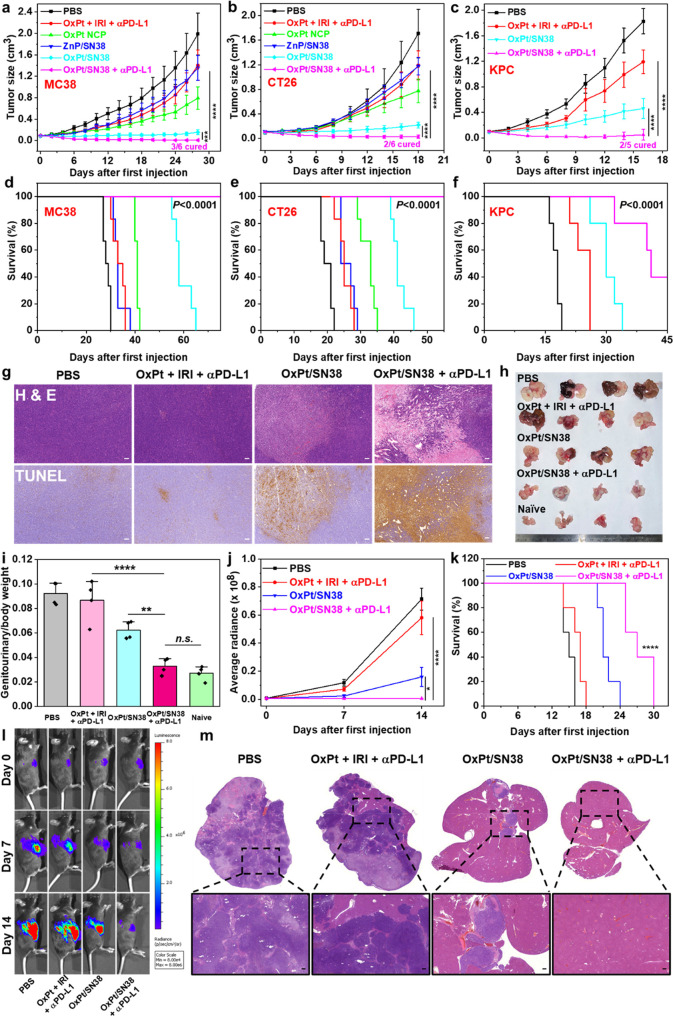
Figure 4.
In vivo anticancer efficacy. Tumor growth curves (a) and survival curves (d) of MC38 tumor-bearing C57BL/6 mice after indicated treatments, n = 6. Tumor growth curves (b) and survival curves (e) of CT26 tumor-bearing BALB/c mice after indicated treatments, n = 6. Tumor growth curves (c) and survival curves (f) of KPC tumor-bearing C57BL/6 mice after indicated treatments, n = 5. PBS, OxPt plus IRI, OxPt NCP, ZnP/SN38, or OxPt/SN38 was intravenously dosed once every 3 days with 3.5 mg/kg OxPt or and 6.2 mg/kg SN38 equiv to the MC38 model (eight doses) and CT26 and KPC models (six doses). A 75 μg portion of anti-PD-L1 antibody (αPD-L1) was i.p. injected in the same dosing schedule. (g) H&E staining and TUNEL IHC staining of excised MC38 tumors at the end point. Scale bars: 100 μm. Photo (h) and ratios of genitourinary tract weights versus total body weights (i) of TRAMP mice treated with PBS, OxPt plus IRI plus αPD-L1, OxPt/SN38, or OxPt/SN38 plus αPD-L1 at an equivalent dose of 3.5 mg/kg OxPt and/or 6.2 mg/kg SN38 Q3D for ten doses, n = 4. MC38-OVA-luciferase luminescence intensities (j), survival curves (k), and in vivo imaging (l) of C57BL/6 mice with liver metastases at different time points. Seven days after injection of MC38-OVA-luciferase cells into the spleens, mice were treated with PBS, OxPt plus IRI plus αPD-L1, OxPt/SN38, or OxPt/SN38 plus αPD-L1 at an equivalent dose of 3.5 mg/kg OxPt and/or 6.2 mg/kg SN38 Q3D for 5 doses, n = 5. (m) Representative images of H&E staining of livers of C57BL/6 mice with liver metastases at the end point. Scale bars: 100 μm. Data are expressed as means ± SD. The data were analyzed by Student’s two-tailed t test (a, b) or one-way analysis of variance (ANOVA; c, i–k). *p < 0.05, **p < 0.01, ***p < 0.001, ****p < 0.0001. A log-rank (Mantel–Cox) test was used for statistical analysis of survival curves.

