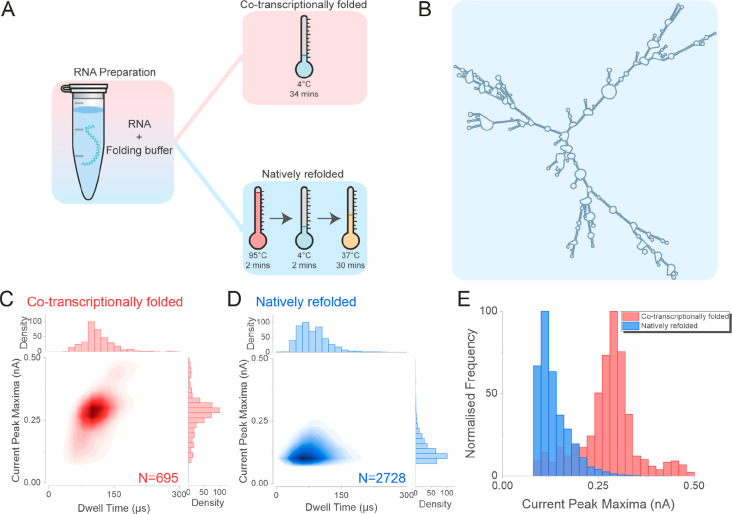
Figure 5.
Nanopore analysis of the co-transcriptionally folded and natively refolded CHIKV RNA genome. (A) The 1987 nt CHIKV RNA was transcribed in vitro and then either incubated at 4 °C (co-transcriptionally folded, red panel) or subject to the refolding procedure to enable it to adopt a stable (native) conformation (natively refolded, blue panel). The RNA was incubated at 95 °C for 2 min followed by 4 °C for 2 min and finally at 37 °C for 30 min. (B) An in silico free energy minimization model, showing the predicted secondary structure of the natively refolded 1987 nt RNA fragment. The population scatters of the co-transcriptionally folded RNA (C) and the natively refolded RNA (D). (E) The current peak maxima histogram of the co-transcriptionally folded (Red) and the natively refolded CHIKV RNA (Blue) translocation data. Four independent nanopore experiments were performed for each RNA sample. N is the number of events plotted.

