
Fig 5.
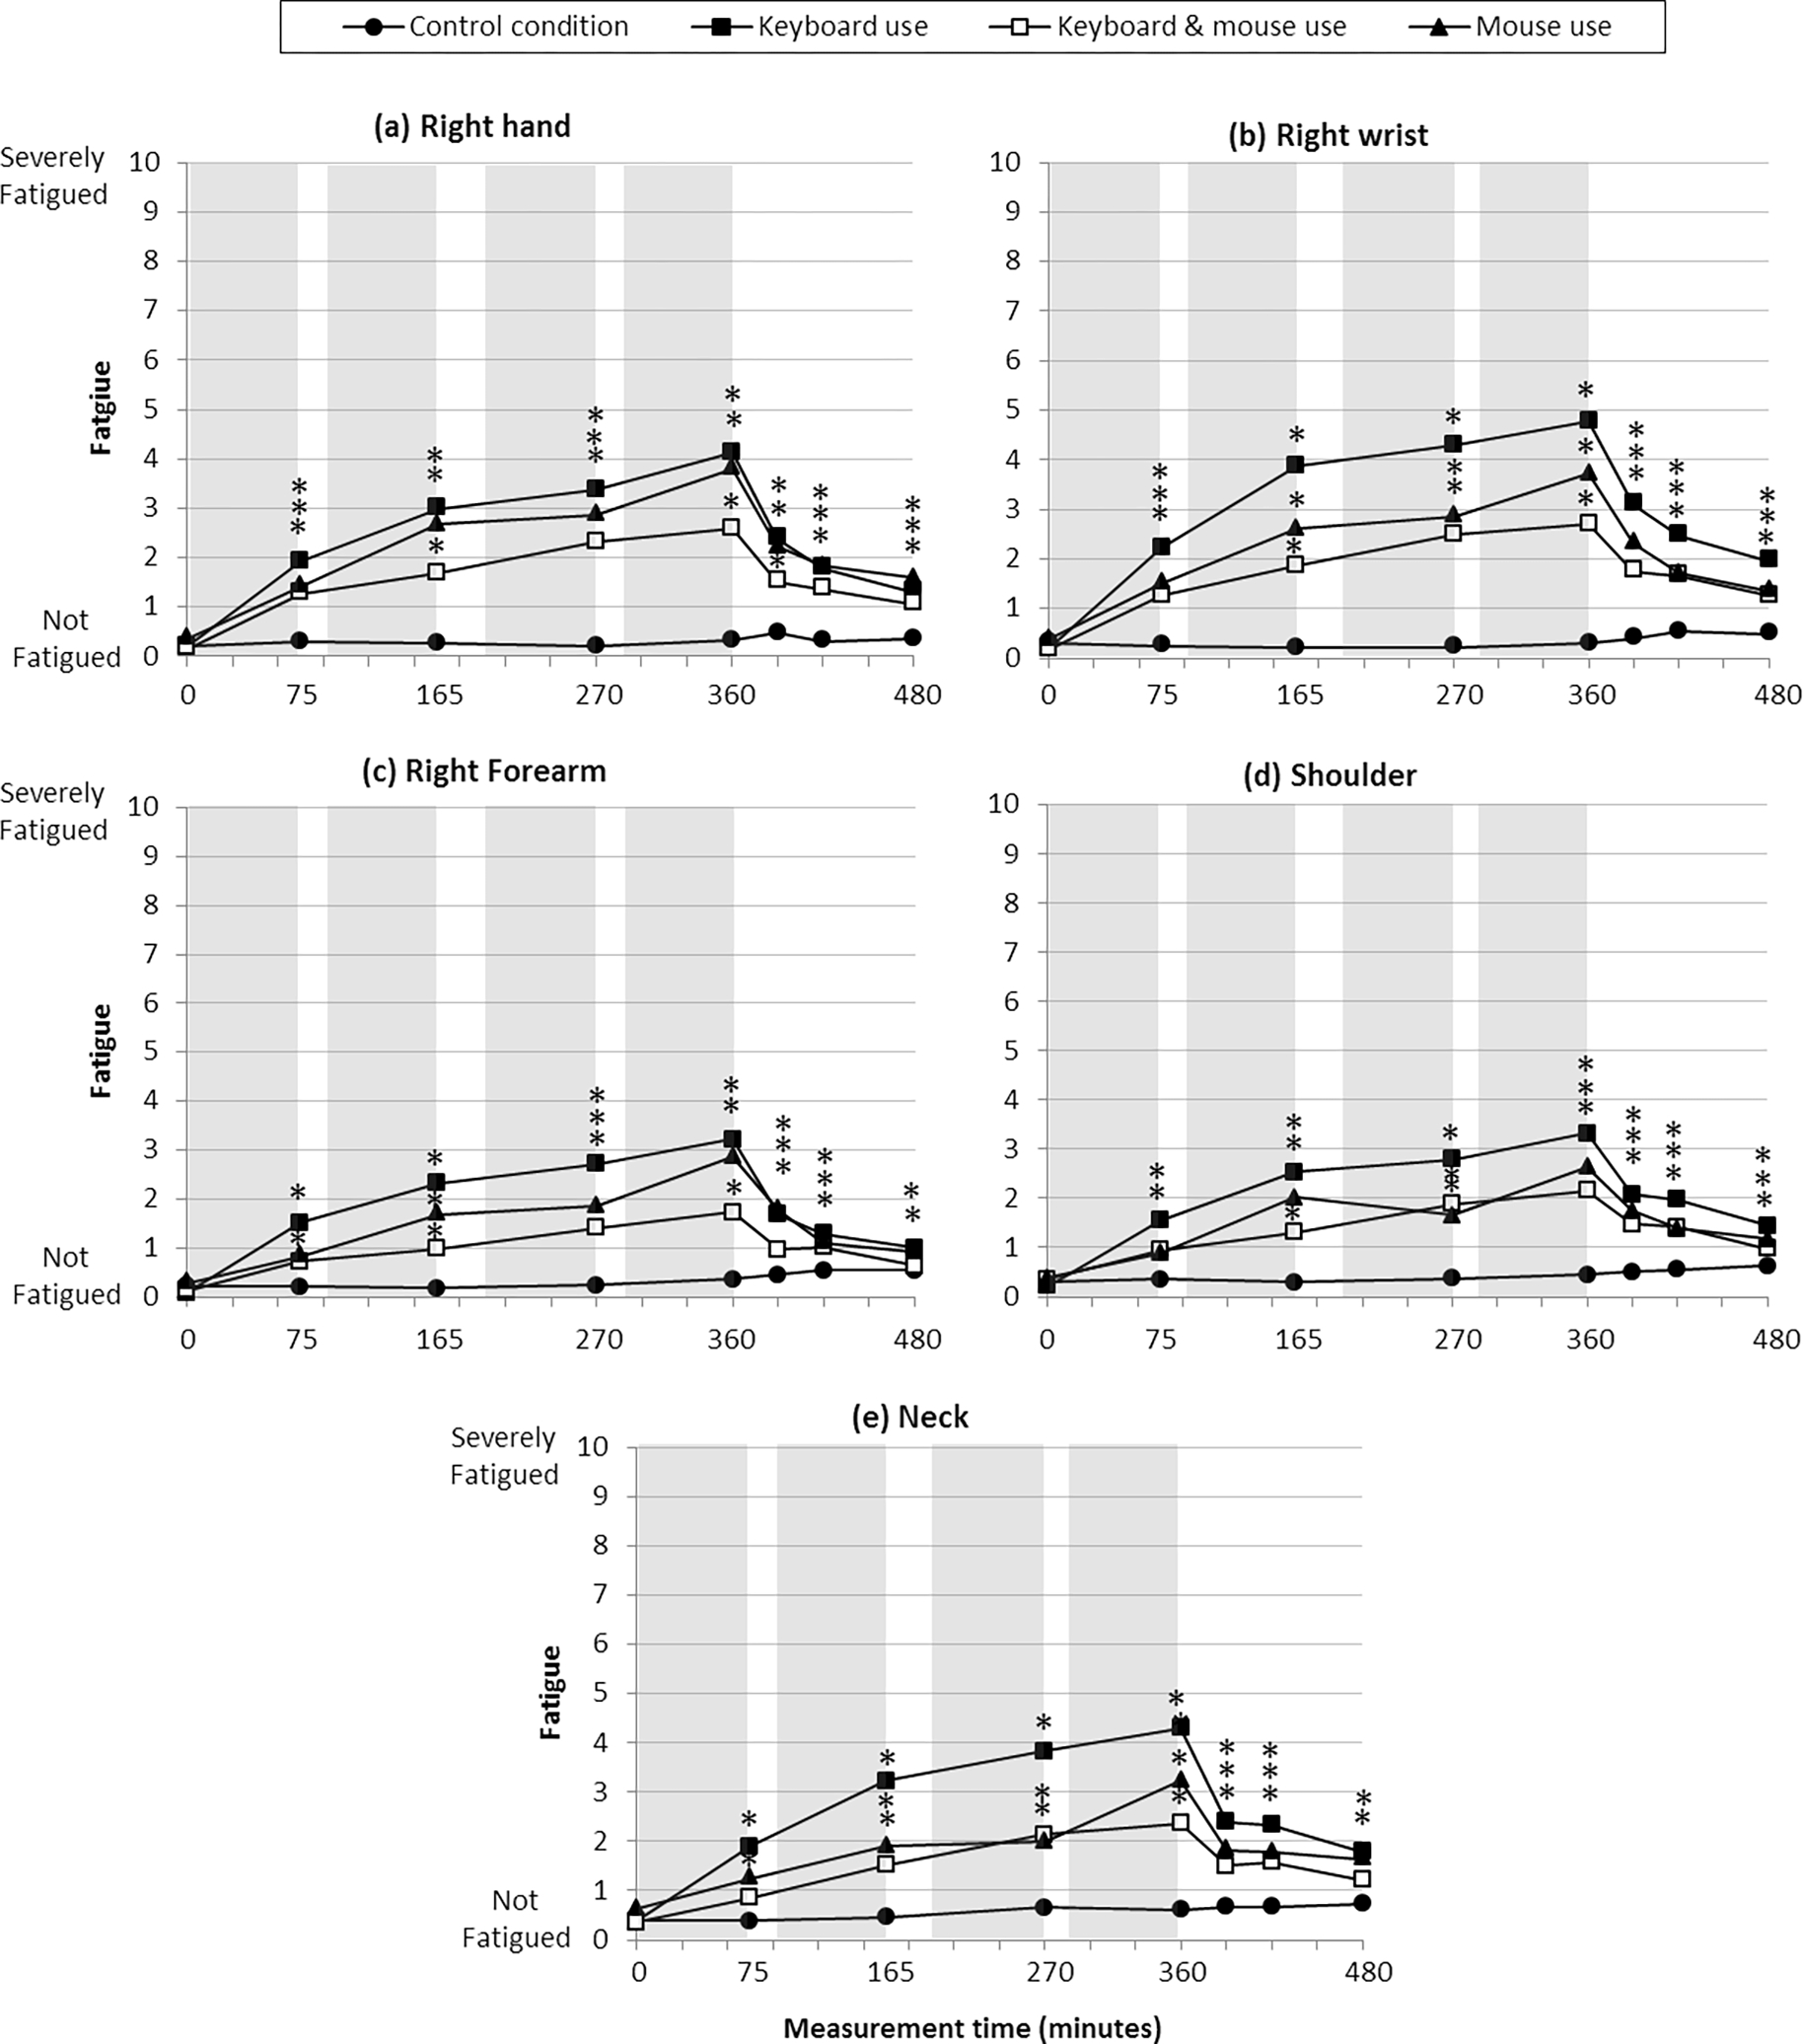
Changes in subjective peripheral muscle fatigue measures [n = 18]. Shaded columns indicate 75-minute blocks of exposure time (keyboard and/or mouse use); white columns indicated the rest breaks between the blocks (15, 30, and 15 minutes, respectively) and the two-hour recovery periods. All the values normalized by the initial values at time 0. Asterisks denote statistically significant differences from baseline measures at time 0 (p < 0.05). Standard error bars were omitted for clarity