
Fig. 2 |. The PVH controls leukocyte homing to the bone marrow during stress.
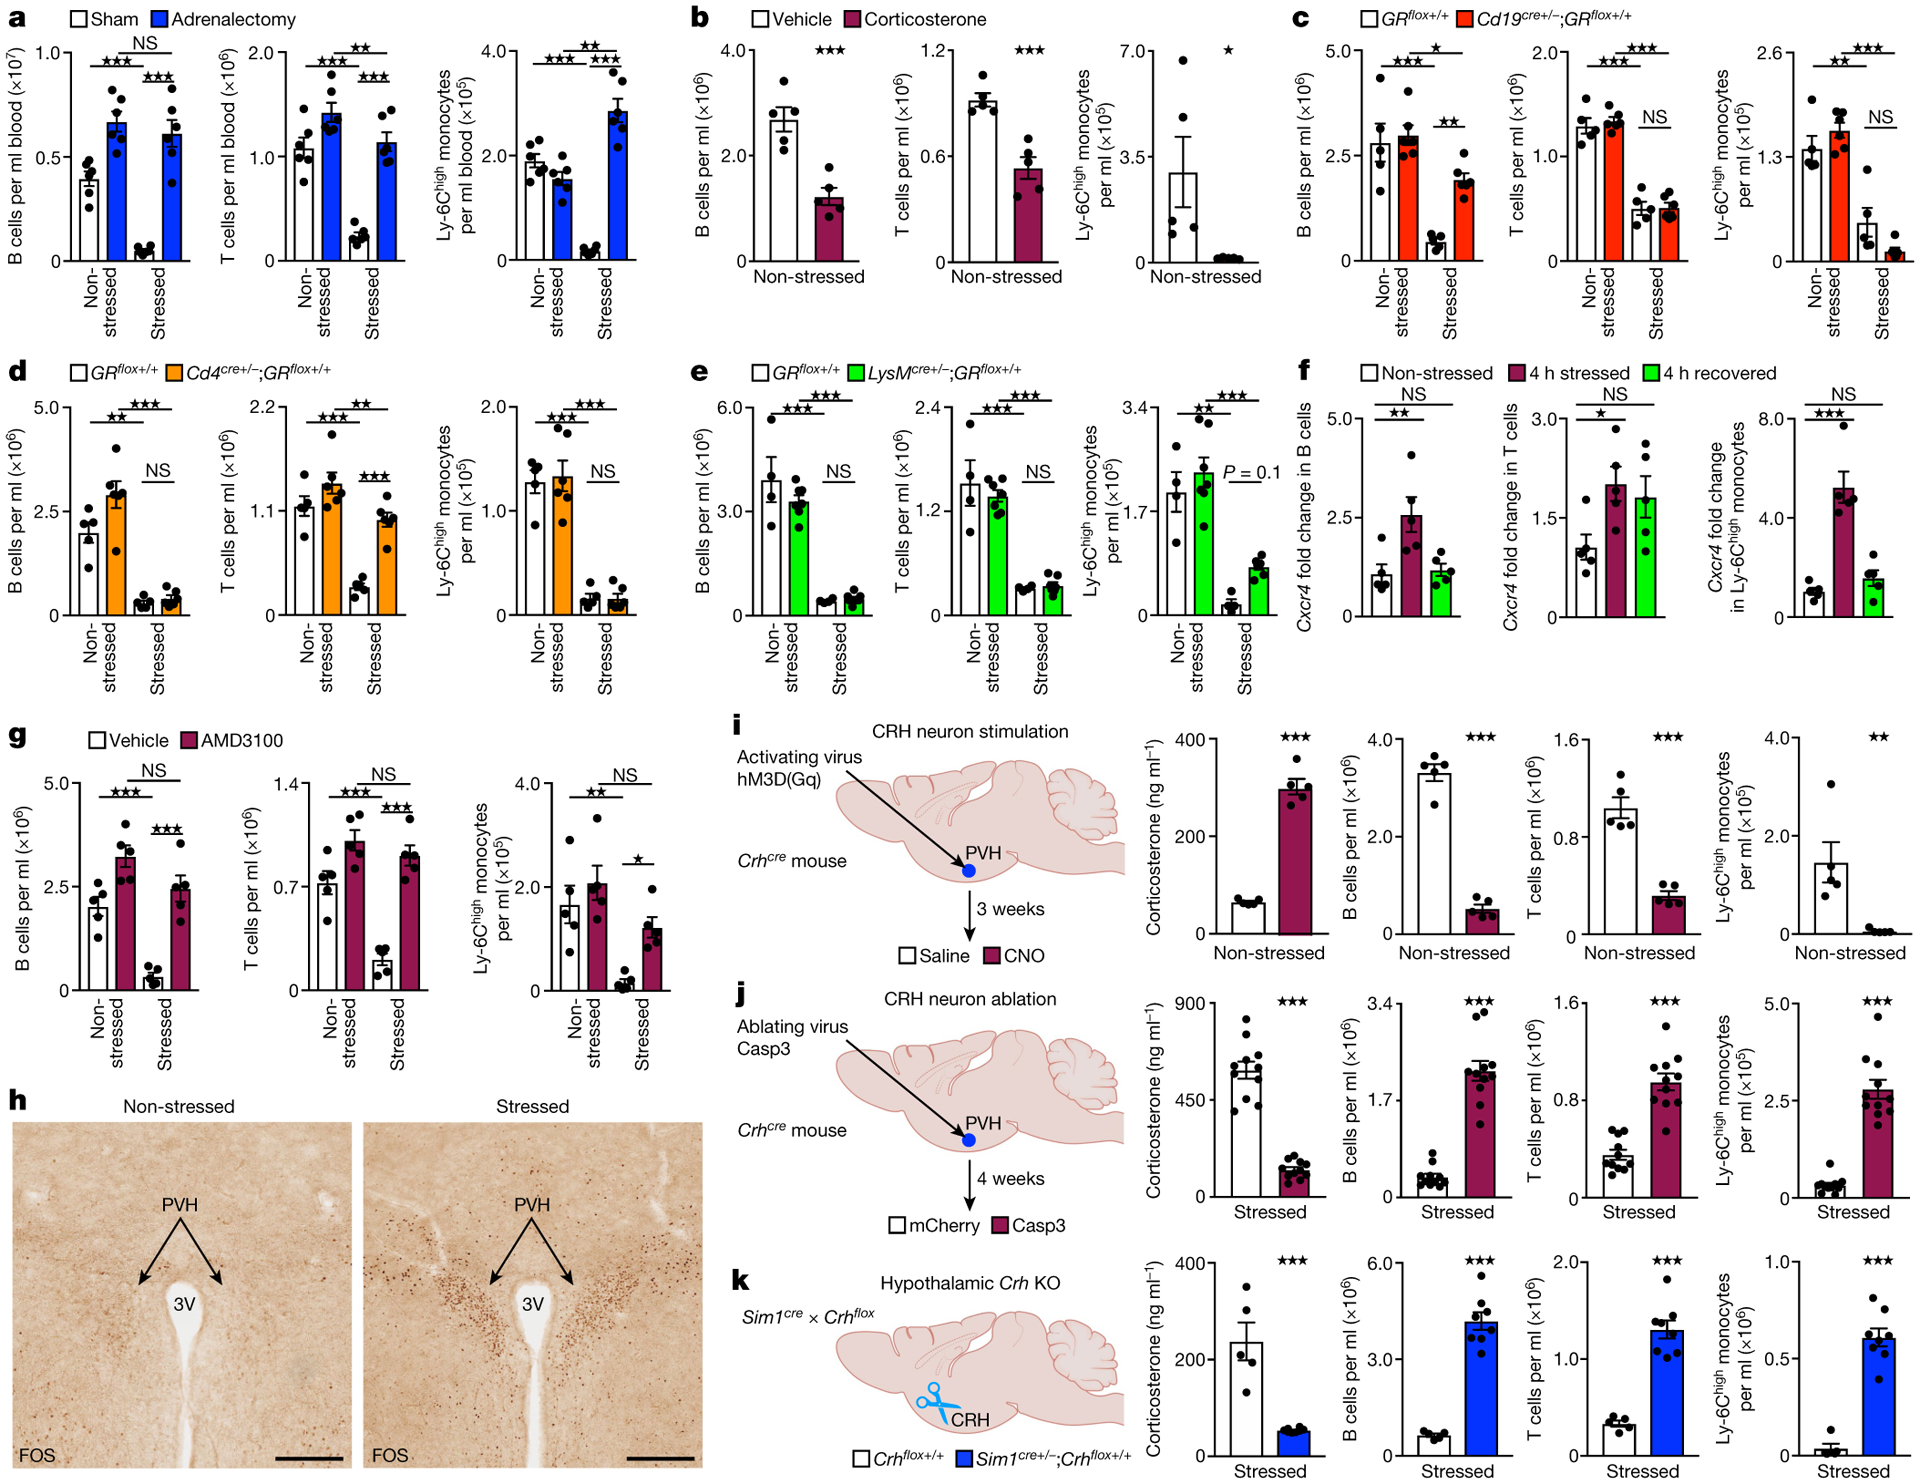
a, Blood leukocytes in the indicated groups at the baseline and after 4 h of restraint. n = 6 mice per group. b, Blood leukocytes after injection of vehicle or corticosterone into wild-type (WT) mice. n = 5 mice per group. c–e, Blood leukocytes of mice with B-cell-specific (n = 5 (control) and n = 6 (KO) mice) (c), T-cell-specific (n = 5 (controls) and n = 6 (KO) mice) (d) and myeloid-specific (n = 4 (control) and n = 7 (KO) mice) (e) KO of the GR at the baseline and after 4 h of restraint. f, Transcript expression of Cxcr4 in sorted blood leukocytes of WT mice under the indicated conditions. n = 5 mice per group. g, Blood leukocytes in WT mice that were injected with CXCR4 inhibitor versus vehicle under the indicated conditions. n = 4 groups, n = 5 mice per group. AMD3100 or vehicle was injected intraperitoneally 30 min before stress onset. Control mice injected with AMD3100 and vehicle remained non-stressed until bleeding at 4.5 h after injection. h, Immunohistological staining of FOS+ neurons in the PVH of non-stressed control mice and restraint-stressed mice. 3V, third ventricle. Scale bars, 200 μm. i, Experimental schematic, plasma corticosterone and circulating leukocytes 5 h after intraperitoneal injection of clozapine-N-oxide (CNO) or vehicle. n = 5 mice per group. j, Experimental schematic, plasma corticosterone and circulating leukocytes in response to a 4 h restraint episode in mice injected with Caspase-3 virus versus mCherry-control virus. Total from two combined experiments; n = 11 mice per group. k, Experimental schematic, plasma corticosterone and circulating leukocytes in response to a 4 h restraint episode in hypothalamic Crh-KO mice (n = 8 (Sim1cre+/−;Crhflox+/+)) and control mice (n = 5 (Crhflox+/+)). For a–g and i–k, data are mean ± s.e.m. Statistical analysis was performed using one-way (f) and two-way (a, c, d, e and g) ANOVA, and two-tailed unpaired t-tests (b and i–k); ★P < 0.05, ★★P < 0.01, ★★★P < 0.001.